Why Retailers Often Earn More Cash From Brands Than From Store Brands
Percentage margins hide how much cash a brand earns the retailer per meter of shelf.
The short version
- Store brands are winning units, but the growth in dollar sales comes from brands. American store brands took a record 23.8 percent of units in the six months to mid-June 2026, yet their dollar sales were flat while national brands grew by 2.2 percent.1
- A higher percentage margin on a store brand can still mean less cash. Finnish retailers made 31.4 percent on store brands in 2022 and 25.8 percent on other products. In most food groups store brands earned them fewer euros a unit.2
- Brands also pay retailers money that does not appear in the shelf margin. Sainsbury's supplier income was about half its retail operating profit in 2024/25, before the per-unit promotional payments it counts in the cost price.3
- A brand can earn the retailer more cash and still look worse in the category buyer's figures. In the worked example, a brand earns the retailer 60 percent more cash per meter of shelf than the store brand, yet trails on front margin if its promotional funding is booked outside the category.
- A brand's strongest case is what the retailer would lose by delisting it. In the example, that is 1,204.50 euros a year on one meter.
What does the record store-brand share show?
In July 2026 the Private Label Manufacturers Association reported that store brands, also called private label or own label, took a record 23.8 percent of American unit sales in the six months to mid-June 2026. Their dollar sales were flat, while national brands grew by 2.2 percent.1
Because store brands often carry the higher percentage margin, a report that ranks products by it shows their gains in units as good news and misses where the dollar growth comes from.
Why does the retailer's margin report often favor the store brand?
Finland's competition authority measured the main food groups using retailers' own buying and selling prices. In 2022 retailers made a margin of 31.4 percent on their store brands and 25.8 percent on everything else, yet in euros store brands earned less on average, and came out ahead only in fruit and berries, vegetables and fish.2
The percentage gap is not the same everywhere. In Norway, the same report notes, it runs the other way: store brands' gross margin averages about 12 percentage points below other products'. In Finland, comparing matched products within each chain shrinks the gap from about 5 points to about 2.2
Meat is the one main food group in Finland where the retailer's percentage margin is higher on brands. Of the 91 cents a kilo more that shoppers paid for a brand in 2022, the retailer kept 45 cents as extra margin, about half, against the meat processor's 11 cents. Most of the rest paid for more expensive raw meat.4
A store brand's higher percentage margin often comes with fewer euros a unit, because it is taken on a lower shelf price.
What does a brand pay the retailer beyond the shelf margin?
Brands also pay retailers rebates, promotional funding and retail media, and most of it counts in the retailer's gross margin. In the year to March 2025 Sainsbury's, a British grocer, booked 507 million pounds of income from brands and other suppliers, about half its retail underlying operating profit of 1,036 million pounds (507 divided by 1,036 is 49 percent). That leaves out money paid per unit, typically "an agreed sum per item sold on promotion", which Sainsbury's counts in the cost price and says makes up "the majority of all supplier arrangements".3
The retailer's P&L cascade
The Academy's lesson on the retailer's profit and loss (P&L) reads a product in four lines. Front margin = consumer sales (what shoppers pay, after promotional discounts) minus cost of goods (units times the brand's invoice price). Back margin = rebates plus other terms, such as fees and media, plus promotional funding: what the brand pays off the invoice. Total gross margin = front margin plus back margin. Net margin = total gross margin minus the retailer's own costs of selling the product, such as handling and waste: the cash it keeps. Retailers judge their category buyers, the managers who run a category and negotiate with brands, on different lines: some on front margin alone, others on a margin that includes whatever brand money is booked to the category.
Much of what a brand pays the retailer sits outside the shelf margin, and a store brand brings in almost none of it.
What does one meter of shelf earn the retailer?
Take an invented grocery category: one meter of shelf in one store over a year, with all prices before tax. The brand sets its list price; the two shelf prices, and the gap between them, are the retailer's decision. The retailer sells 3,000 units of a brand at 2.50 euros each, bought for 1.85 euros. That is the brand's 2.00-euro list price less 7.5 percent, or 15 cents, off the invoice. It sells 3,500 units of its store brand at 1.75 euros, bought for 1.20 euros.
The retailer sells 34 percent of the brand's units on promotion at 20 percent off, and 14 percent of the store brand's at the same discount; those shares are the averages for Europe's six largest grocery markets.5 The brand funds the discount on its promoted units; the retailer funds the store brand's. The brand also pays a rebate of 4 percent of its list price, 8 cents a unit, and 180 euros for retail media, which costs the retailer 54 euros to deliver. Handling costs the retailer 6 cents a unit on both products, and the store brand carries a further 4 cents of overheads, for development and quality checks, and 2 cents of waste.
On shelf margin, the retailer makes 31.4 percent on the store brand (55 cents of 1.75 euros) and 26.0 percent on the brand (65 cents of 2.50 euros). The store brand also leads on front margin after promotions, before the brand's funding is counted, by 1,753.50 euros to 1,440. The brand makes 65 cents on 1,980 full-price units and 15 cents (the promoted price of 2.00 less 1.85) on its 1,020 promoted ones (34 percent of 3,000). The store brand makes 55 cents on 3,010 units and 20 cents (the promoted price of 1.40 less 1.20) on 490 (14 percent of 3,500).
Further down the cascade the brand pulls ahead. Its back margin is 930 euros: 510 of promotional funding (50 cents on each promoted unit), the 240-euro rebate (8 cents on 3,000 units) and 180 of media. That gives a total gross margin of 2,370 euros (1,440 plus 930). After 180 of handling (6 cents on 3,000 units) and the 54 the media costs to deliver, its net margin is 2,136 euros, 71 cents a unit. The store brand has no back margin, so its net margin is its front margin less 420 euros of handling, overheads and waste (12 cents on 3,500 units): 1,333.50 euros, 38 cents a unit. The brand's 2,136 is 1.60 times that (2,136 divided by 1,333.50). The lesson's net margin counts only the store's own selling costs; this example also charges each product the costs the retailer carries only because of it: the store brand's development and quality checks, and the media's delivery.
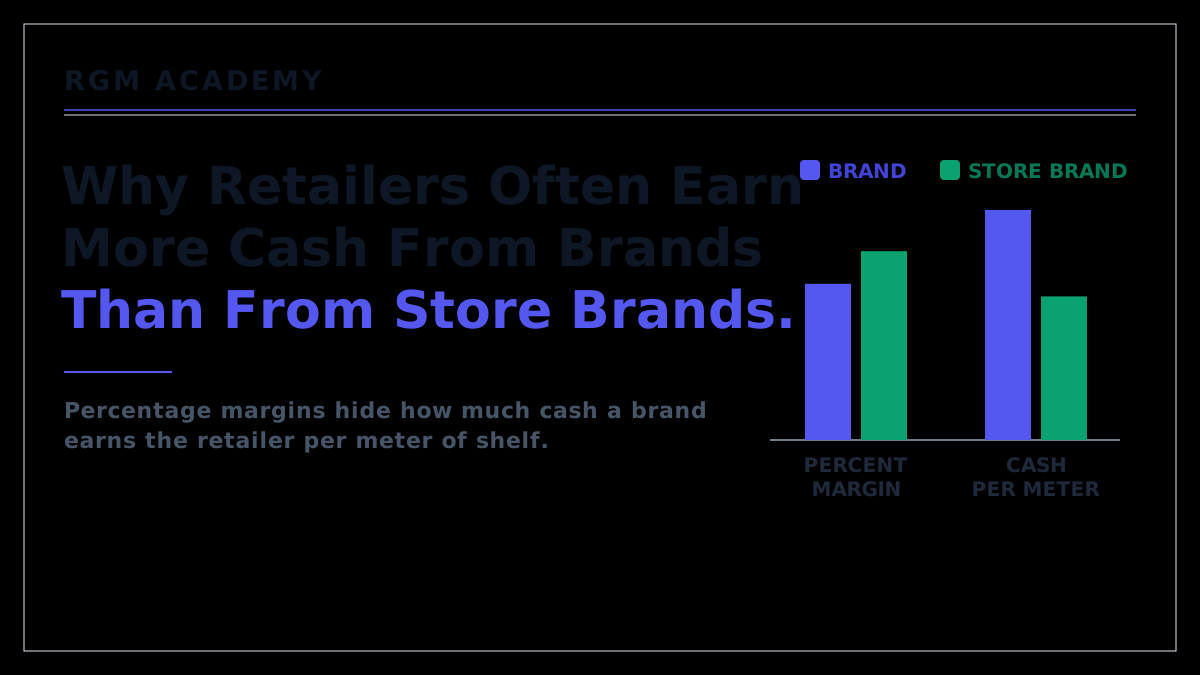
On cash, the brand earns the retailer about 60 percent more than the store brand, although it trails on percentage margin, and on front margin when its promotional funding is booked outside the category.
What is the brand's own money buying?
The example assumes the retailer passes all 510 euros of promotional funding on to shoppers, so a promoted unit still earns it 65 cents, as at full price: 15 cents at the shelf plus 50 of funding. How much it passes on is the retailer's decision: passing on less would raise that 65 cents, and passing on more would lower it. The funding therefore only replaces the 50 cents a unit given away on the shelf. If the promotions sold no extra units, the retailer would be no better off than at full price. Only the rebate and the media are money it would not otherwise have had: 366 euros (240 plus the 126 the retailer keeps from the 180), about a sixth of the 2,136.
What the category buyer sees depends on how the retailer books the funding. A retailer that counts it in the cost price, as Sainsbury's does, shows its category buyer 1,950 euros of front margin on the brand (1,440 plus 510), ahead of the store brand's 1,753.50. One that collects it later and books it outside the category shows 1,440, behind the store brand. The brand's key account manager should ask which payments are booked to the category, and set the payments booked elsewhere beside any front margin the retailer quotes.
Without the rebate, the media and the promotions, the retailer still earns 59 cents on each brand unit after handling (65 cents less 6). On the same 3,000 units, that is 1,770 euros: the 2,136 less the 366, because the promotions and their funding cancel out. That beats the store brand's 1,333.50 unless the brand sells fewer than 2,260 units (1,333.50 euros divided by 59 cents). It falls behind only if ending its promotions cost it more than 740 units (3,000 less 2,260), about a quarter of its sales.
Even without its payments, the brand earns the retailer more cash than the store brand, unless promotions drive over a quarter of its sales.
Which number should decide the shelf space?
The number that matters most is what the retailer would lose if the brand left this meter entirely, rather than losing some of its space. Suppose half the brand's shoppers switch to the store brand, a fifth to another brand that earns the retailer 60 cents a unit, and the rest buy nothing in that store. Of the brand's 2,136 euros, the retailer wins back 571.50 through its store brand: 1,500 units (half of 3,000) at 38.1 cents, the store brand's net margin a unit, overheads included. It wins back 360 through the other brand: 600 units (a fifth) at 60 cents. That leaves it 1,204.50 euros a year worse off on one meter (2,136 less 571.50 and 360), before counting shoppers who take their whole basket elsewhere.
Recapture
Recapture is the share of a product's sales the retailer keeps if the product goes, because shoppers switch to its store brand or to another brand. The higher it is, the less the shelf space is worth. The cheapest estimate is the brand's own out-of-stock history: compare the whole category's sales in the stores and weeks the product was missing with normal weeks. It flatters the brand, because in a short stock-out some shoppers wait, and they would switch if the product were gone for good. Switches to the brand's own other packs count as lost, because delisting the brand removes those packs too.
A retailer may reply that a brand worth so much should pay more to stay. Yet on the brand's sales alone, without its rebate, media or promotions, delisting would still cost the retailer 838.50 euros a year (1,770 less the same 931.50 won back). The test does not say what the brand should pay: a brand often loses more from a delisting than the retailer does, and the usual threat is less shelf space or fewer promotion slots, which cost the retailer little. But it shows where extra payments make sense: on meters where, without them, the retailer would gain by delisting the brand, and where the brand's own margin can afford them.
What the retailer would lose by delisting the brand is a stronger argument for its shelf space than any margin percentage.
Where is the brand's case weakest?
A credible store brand gives the retailer an alternative if talks with a brand fail. A 2026 study by Paul Ellickson and colleagues traces part of a retailer's gain from its store brand to "a better bargaining outcome on national-brand products".6 Koen Pauwels and Shuba Srinivasan found in 2004 that a store brand's arrival typically benefits the retailer, shoppers and premium brands, "while harming second-tier brand manufacturers".7 A second-tier brand, priced between the leader and the store brand, has less shopper loyalty to bargain with, so its case rests more on the retailer's cash.
A premium store-brand range priced close to the brands can close the cash gap per unit, and if it also wins most of a brand's shoppers, losing the brand costs the retailer little. Some are growing fast: sales of Sainsbury's Taste the Difference range rose by 15 percent in 2024/25.3 A retailer pursuing a store-wide target for its store-brand share may also accept less cash on a meter, or delist a brand at a loss as a warning to other brands.
A brand's key account managers therefore need more than the margin figure the retailer quotes. A one-page retailer P&L for the brand shows the cash, from front margin to net margin, beside the same lines for the store brand, whose buy price they will have to estimate.
A brand argues best from the retailer's own profit: the cash it earns on the brand, and what delisting the brand would cost it.
References
- Private Label Manufacturers Association, "Store Brands Continue Gains in Unit Sales and Shares", 8 July 2026, Circana data against the same period a year earlier (units for the six months ending 14 June 2026, dollar figures year to date): store-brand units up 0.2 percent and national-brand units down 0.5 percent; store-brand unit share 23.8 percent, an all-time high; store brands flat in dollars against national brands up 2.2 percent; dollar share 21.2 percent. plma.com
- Finnish Competition and Consumer Authority (KKV), Research Reports 3/2025, private label products in the food market: in 2022 the retailer's margin was 31.4 percent on private label against 25.8 percent on other products; private label's margins in euros were on average smaller, larger only in fruit and berries, fish (2022 only) and vegetables; the report cites the Norwegian competition authority's finding that own-label gross margins in Norwegian grocery chains run on average 12 percentage points below other products, and finds that comparing matched products in the same chain narrows the gap from about 5 points to about 2. In Finnish. kkv.fi
- J Sainsbury plc, preliminary results for the 52 weeks to 1 March 2025, group retail including Argos: supplier income recognized in the income statement of 507 million pounds (fixed amounts 293, supplier rebates 40, marketing and advertising income 174, up from 134); discounts and supplier incentives "represent the majority of all supplier arrangements", are "typically based on an agreed sum per item sold on promotion" and are "considered part of the purchase price of that product"; retail underlying operating profit 1,036 million pounds; Taste the Difference sales up 15 percent. fca.org.uk
- Finnish Competition and Consumer Authority (KKV), Research Reports 1/2026, industry profitability and private label in the meat sector: the 20 best-selling private-label meat products in each retail group matched with near-identical branded products at the same retailer; in 2022 the brand premium averaged 0.91 euros a kilo, of which the retailer's extra margin was 0.45 and the processor's about 0.11; meat is the main food group where the retailer's percentage margin is higher on brands. In Finnish. kkv.fi
- Circana, "Private label reaches record 50% unit share across Europe's six biggest grocery markets", April 2026: in France, Germany, Italy, the Netherlands, Spain and the UK, 34 percent of branded unit sales were on promotion against 14 percent for private label. circana.com
- Paul Ellickson, Mitchell Lovett, Takeaki Sunada and Pianpian Kong, "Private Labels and Retailer Profitability: Bilateral Bargaining in the Grocery Channel", Journal of Marketing Research, published online 21 August 2026: private-label gains for the retailer arise "both through improved direct profits from the private label, and indirectly through a better bargaining outcome on national-brand products." doi.org
- Koen Pauwels and Shuba Srinivasan, "Who Benefits from Store Brand Entry?", Marketing Science 23(3), 2004: store-brand entry is "typically benefiting the retailer, the consumers, and premium-brand manufacturers, while harming second-tier brand manufacturers". doi.org
Keep going
Pair this with the playbook and the lessons that teach the methods behind it.
Playbook
Respond to private label growth. A five-question guide to whether you defend on brand equity, price, pack or a fighter brand when the store brand takes share. The delisting test in this piece tells you which meters are worth defending.
More from the blog
Three ways brands fight back against private label. The brand's side of the same contest: price, pack and premium moves against a growing store brand.
On-invoice versus off-invoice trade money. Where your trade money lands in the retailer's accounts, and why that decides who it helps.
Retail media networks. How media money enters the joint business plan, and how to judge what it buys.
Lessons inside the course
The retailer P&L mirror →The retailer's P&L line by line, from shelf price to net margin, with front and back margin and the bands that show how much of the retailer's margin depends on you. It rebuilds the page the retailer's category buyer reads.Start the lesson → Dual P&L and win-win analysis →Your P&L and the retailer's side by side, and why the category buyer's report shows less than you paid: which of your payments the retailer charges to the category and which it keeps centrally. Ask that before you quote the front margin above.Start the lesson → Trade terms negotiation →Walk-away options on both sides, including what happens when your product is missing: whether shoppers leave the store or switch. The delisting test above adds what each switch is worth to the retailer.Start the lesson → Promo ROI fundamentals →Who gains from a promotion, the retailer or you, and why a deal that pays for one side can cost the other. Its retailer view counts your funding beside the discount, the habit this piece asks you to bring to the negotiation.Start the lesson →Try it free
Retailer P&L Simulator. See what eight levers do to the retailer's front margin, back margin, total gross margin and net margin on one product, the numbers this article works through. The same model as the Academy's lesson on the retailer P&L, free and without sign-up.