Which Parts of a Profit Recovery Will Repeat Next Year: The Case of Bega
A profit bridge that counts every dollar shows which gains a company can earn again.
The short version
- Bega's normalized earnings before interest, tax, depreciation and amortization rose 11.7 percent in the year to June 2026, helped at once by volume, protein demand, a portfolio exit, cheaper inputs and a better match between dairy prices and what it pays farmers for milk.
- For the year to June 2027 Bega expects about 38 million Australian dollars of savings from consolidating its cheese plants and automating a warehouse, more than its whole guided rise in earnings.
- The Academy's profit bridge splits a year's change in contribution, the profit left before marketing and overheads, into price, mix, volume, cost, trade terms and promotion, with nothing left over. The keep rate (the share of each list dollar left after trade terms and promotions), with the cost each extra list dollar brings, decides how much of that dollar reaches profit.
- Read the bridge for what will repeat. A cost step, a one-time cut in costs, keeps its saving in later years but appears in one year's bridge only. The bars a commercial team can earn again are price that shoppers accept as value, a richer mix and volume that marketing keeps supporting.
What drove Bega's recovery?
Bega, an Australian dairy and food company that owns brands such as Dairy Farmers, Farmers Union and Vegemite, reported its results for the year to 30 June 2026 on 20 August 2026. Normalized EBITDA (earnings before interest, tax, depreciation and amortization, excluding items Bega treats as one-off) rose 11.7 percent to 225.6 million Australian dollars. Statutory profit after tax swung from an 8.5 million loss to a 54.8 million profit.1
Bega's branded business, which made 220.7 million of normalized EBITDA, cites strong volume growth in yoghurt, milk drinks and white milk, demand for high-protein and "better for you" products supported by higher marketing, and savings from leaving peanut processing. Its bulk business, which sells dairy ingredients and commodities, made 53.2 million. Bega gives four reasons for bulk's rise: more of its bulk ingredients used in its own brands, stronger sales of nutritional powders, more milk and a richer ingredient mix, and "an improved alignment of dairy commodities and farm gate milk prices, particularly in the first half".1 The annual report adds lower input costs, "particularly for cheese, peanuts and citrus".2
Bega's own bridge of the year, which breaks the change in earnings into parts, is by business, not by price, volume, mix and cost. Branded added 15.5 million and bulk 14.5 million. Central costs rose 5.6 million and eliminations on sales between them took 0.8 million.3 Bulk's 14.5 million is almost half of the two businesses' 30.0 million gain. Only bulk's commodity products, such as bulk cheese, skim milk powder and butter, are in Bega's words "traded with price linkages to global commodity indices". Bega's plan to 2031 expects bulk earnings of 30 to 50 million a year, below the 53.2 million of the year to June 2026.4
Bega's recovery came from volume, protein, a portfolio exit, cheaper inputs and a better match between dairy and farm milk prices, and its own bridge does not show which of them it can repeat.
What will lift profit in the year to June 2027?
Bega completed two projects in the year to June 2026. It closed its Strathmerton cheese site and moved the work to Ridge Street, "with $30 million of annualised cost savings starting in FY2027", the year to June 2027. Its automated warehouse at Laverton is expected to save almost 8 million a year. "Together, these are expected to deliver approximately $38 million in savings in FY2027."2
Bega's guidance for that year is normalized EBITDA of 240 to 245 million, "subject to normal trading conditions", a rise of 14.4 to 19.4 million on 225.6.1 Bega does not split its guidance, so what follows is a calculation on its published figures. If all 38 million of savings arrive and all of it is new, everything else in the business adds up to a fall of about 19 to 24 million (38 less 19.4, and 38 less 14.4). Laverton went live in the second half of the year to June 2026, so a little of its saving may already be in the base, which would make the fall slightly smaller. Bega's investor day in April 2026 points to one reason for the fall: its yearly savings "help partly mitigate inflation".4
Bega expects a one-time cost step larger than its whole guided rise, so its own numbers raise the question of which of its gains will repeat.
How does the Academy's profit bridge work?
The Academy's lesson on the manufacturer's profit and loss account (P&L) starts from the list price and follows each dollar down to contribution, the profit left before marketing, the sales force and overheads.
From list price to contribution, and the keep rate
Gross Sales = List Price x Volume. Net Sales = Gross Sales x (1 - Total GTN Rate), where the gross-to-net (GTN) rate is the share of list taken by trade terms and promotions. Contribution is Net Sales less the cost of goods sold (COGS) and outbound distribution. The keep rate is 1 minus the trade terms rate minus the promotional rate: 0.83 in the lesson's starting example, where terms take 11 percent and promotions 6. On the lesson's biscuit, a list dollar from a price rise keeps "about 83 cents" for contribution, while a list dollar that arrives with one more pack keeps about 35 cents, because the pack also brings its own cost.
Profit Bridge Decomposition: six bars, no residual
Price Effect = Base Volume x Keep Rate x change in list price. Mix Effect = Base Volume x (Keep Rate x extra blended list from the mix shift - extra unit COGS from the mix shift). Volume Effect = (Future Volume - Base Volume) x Marginal Contribution, the contribution a unit earns after the price and mix moves but before the change in COGS, which has its own bar. COGS Effect = -(change in unit COGS) x Future Volume. The trade terms and promotion effects are each the fall in their rate times future gross sales. In the lesson's words: "Base Contribution + Price + Mix + Volume + COGS + Trade Terms + Promo = Future Contribution, exactly, with no residual."
Bega does not publish what this bridge needs. Its EBITDA is measured after marketing and overheads, which the lesson takes off below contribution, and it reports revenue "net of returns, trade allowances, rebates", so its keep rate and any change in its trade terms are invisible.2 An invented dairy brand teaches the bridge instead. It sells 10,000,000 units a year to retailers at a list price of 3.00 dollars, the manufacturer's price. Its keep rate is 0.83, so the net price is 2.49 dollars. COGS is 1.50 a unit and outbound distribution 0.20, which leaves 0.79 a unit and 7,900,000 dollars of contribution. In the following year the brand raises its list price 2 percent (6 cents). It shifts its mix toward high-protein lines, which adds 3 cents of blended list (the average list price across its lines) and 1 cent of COGS a unit. It sells 3 percent more units, helped by category growth and marketing. A plant consolidation cuts COGS by 5 cents a unit. Trade and promotion rates do not change.
The price bar is 498,000 dollars (10,000,000 units times 0.83 times 0.06). The mix bar is 149,000 (10,000,000 times 0.0149, which is 0.83 times 0.03 less 0.01). The volume bar is 256,410: 300,000 more units at a marginal contribution of 0.8547. That is 0.83 times 3.09 (the list after the price and mix moves), less 1.51 of COGS after the mix shift, less 0.20 of distribution. The COGS bar is 515,000 (5 cents on 10,300,000 units). Trade terms and promotion add nothing.
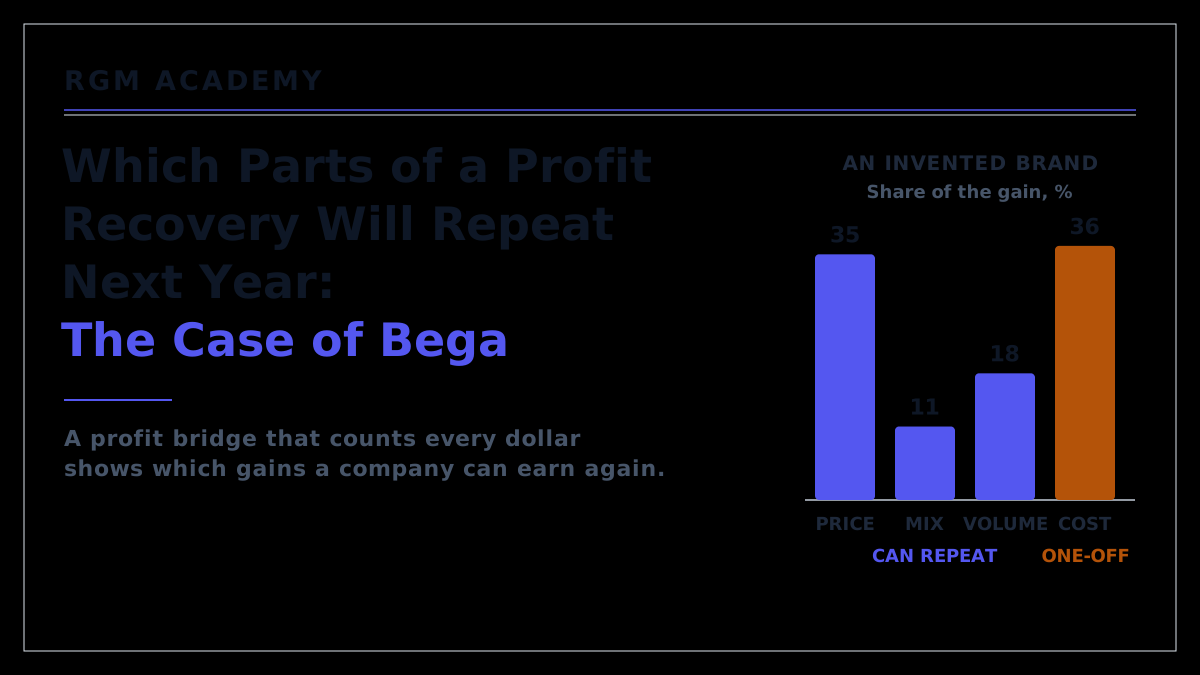
As a check, 10,300,000 units at a future contribution of 0.9047 a unit (0.83 times 3.09, less 1.46 of COGS, less 0.20) gives 9,318,410 dollars. Adding the four bars to 7,900,000 gives the same 9,318,410. Contribution rose 17.95 percent, a gain of 1,418,410 dollars on 7,900,000. The cost bar is the largest, 36.3 percent of the gain, ahead of price at 35.1, volume at 18.1 and mix at 10.5.
The keep rate and the cost that comes with each extra list dollar show why the bars differ so much. In this example a list dollar from price keeps 83 cents, a list dollar from mix about 50 (0.0149 divided by 0.03) and a list dollar from one more unit about 28 (0.8547 divided by 3.09). A dollar of cost saved reaches contribution in full.
The Academy's free Manufacturer P&L Sensitivity tool, linked below, draws the same six bars on its own biscuit example. With a 2 percent list price rise, a 3 percent cost cut, 2 points more premium mix (a larger share of sales in premium packs) and 3 percent more volume from reasons other than price, contribution rises 8.4 percent. Brand contribution, the line after the brand's fixed costs, rises 11.5 percent, which the tool rates Excellent. With the cost change set back to zero, as in a year with no new factory saving, brand contribution rises 6.8 percent, rated Healthy.
A bridge with no residual names every dollar of a profit change, and the keep rate, with the cost each extra list dollar brings, explains why a dollar from price, from mix or from volume reaches profit at such different rates.
Which bars will repeat?
Under the heading "Reading the Bridge Like a Director", the lesson reads a bridge through three lenses, and two of them help sort the bars: one by who controls them, one by whether they will come back. The controllability lens says that "COGS effects are largely outside commercial control (commodity costs, FX)", where FX means exchange rates. "Trade and promo effects are partially controllable. Price and mix effects are highly controllable." The sustainability lens asks two questions of every bridge: did we hit the number, and "can we hit the number again next year".
In the example, price, mix and volume make up 903,410 dollars, 63.7 percent of the gain, and all three can be earned again. The plant step, the other 36.3 percent, holds, because the lower cost stays in the following year's base, but it does not repeat: the following year's bridge has no COGS bar unless something new happens. Suppose the brand repeats its commercial moves the year after (a 2 percent list price rise, the same mix shift and 3 percent more units, with no cost cut) on its new base of 9,318,410 dollars. The three bars add 981,804 dollars and contribution grows 10.54 percent (981,804 divided by 9,318,410), against 17.95 percent in the year of the plant step. Without the plant step, the 17.95 percent would have been 11.44 percent (903,410 divided by 7,900,000). In the year after, the three bars are larger in dollars than that 903,410, yet the rate is lower, because the base has grown and now holds the plant saving.
Bega's year, read the same way, has bars of very different kinds. Its better match between dairy and farm milk prices and its cheaper cheese, peanuts and citrus are what the lesson calls largely outside commercial control. The peanut exit ended a business that, Bega said in July 2025, had been "incurring operating losses of $5-10 million per annum"; the exit happens once and its saving holds.5 Bega also "implemented a price surcharge on our products for cost increases we cannot reasonably absorb", which it says mainly offset higher fuel and plastic packaging costs, mostly between April and June 2026, and temporary support payments to dairy farmers.2 In a bridge, that is a price bar matched by a cost bar, and a surcharge tied to a cost shock is designed to be removed once the shock passes. Costs explain a price and set its floor, but what shoppers will pay sets the price, and the price bar that lasts is the one that willingness to pay supports.
Bega lifted marketing by 9 million Australian dollars to support its brands and launches.2 Marketing is paid for below contribution, so the bridge counts the volume that marketing bought but not what the marketing cost. Whether the volume bar repeats depends on whether the marketing does. In one Australian consumer goods category, brands that cut all mass-media advertising lost 16 percent of sales on average after one year without it, and 25 percent after two years.6
A cost step holds but does not repeat, a better market price is largely outside the commercial team's control, and a price bar is renewable when its source is value that shoppers pay for rather than a cost surcharge.
Are cost savings not earned too?
The strongest objection is that operations earned the plant step, shareholders keep it every year, and Bega's own plan counts on more than 40 million of supply, procurement and logistics savings a year. A price bar, too, needs a new decision each year.
All of that is right, and the bridge does not call a cost step less real. It records the step once. When a savings program runs every year and only partly offsets inflation, as Bega says its own does, the COGS bar is small or negative. A large bar from savings needs a one-time step, and Bega's step is larger than its whole guided rise. A price bar's source decides whether another rise is likely: a brand can raise its list price again if shoppers keep valuing it, while a plant can be closed once.
A cost saving may also not be kept in full. Lower input costs invite retailers to ask for some of the saving back in the next trade terms negotiation, a risk a manufacturer can plan for in the terms it proposes before that negotiation starts.
Cost savings are as real as price, but a one-time step shows up in one bridge, so a recovery built on it needs a commercial plan for the year after.
What should a board ask of a recovery?
A survey of dairy executives in the United States and Europe, run late in 2025 by McKinsey and two dairy trade associations, found that nearly 70 percent of the US dairy companies it surveyed reported flat or shrinking margins in 2025. Its authors saw "a clear imperative: protect margins and execution in the near term, while investing selectively behind durable growth themes".7 Bega's year shows both in one set of accounts: site closures and an automated warehouse next to protein launches backed by more marketing.
The bridge turns that into three things a board can ask for at the next results review. First, build the bridge with no residual before the review, so every dollar of the change has a name. Second, split the price bar by its source, value that shoppers accept or a cost surcharge, before calling it repeatable. Third, report the share of the profit change that came from bars the commercial team can renew next to the share from one-off steps and from market prices. A team whose renewable share falls year after year is relying on one-off steps and market prices for its growth.
The part of a profit recovery that counts for the year after is the part that can be earned again, and a bridge with no residual, read with the lesson's lenses, shows which part that is.
References
- Bega Group, FY2026 results media release, 20 August 2026: revenue 3,774.6 million against 3,539.0, +6.7 percent; normalised EBITDA 225.6 million against 202.0, +11.7 percent; statutory profit after tax 54.8 million against -8.5 million; "Strong volume growth in branded yoghurt, milk-based beverages and white milk."; "Increased demand for high protein and 'better for you' products, supported by higher marketing."; "Savings associated with the exit of primary peanut processing."; "International revenue growth of 12%."; Bulk normalised EBITDA 53.2 million; "An improved alignment of dairy commodities and farm gate milk prices, particularly in the first half."; "Subject to normal trading conditions, Bega Group provides normalised EBITDA guidance in the range of $240 to $245 million in FY2027." announcements.asx.com.au
- Bega Group, 2026 annual report, 20 August 2026: "lower commodity cost inputs particularly for cheese, peanuts and citrus"; "with $30 million of annualised cost savings starting in FY2027"; Laverton "is expected to deliver almost $8 million in annualised savings"; "Together, these are expected to deliver approximately $38 million in savings in FY2027."; "Implemented a price surcharge on our products for cost increases we cannot reasonably absorb within our existing cost structures"; "The Group backed this innovation with increased marketing investment of $9 million."; "Amounts disclosed as revenue are net of returns, trade allowances, rebates and amounts collected on behalf of third parties." announcements.asx.com.au
- Bega Group, FY2026 results presentation, 20 August 2026, normalised EBITDA bridge, millions of Australian dollars: FY2025 202.0, Branded +15.5, Bulk +14.5, Unallocated (5.6), Inter-segment elimination (0.8), FY2026 225.6. announcements.asx.com.au
- Bega Group, Investor Day presentation, 29 April 2026: Bulk "Traded with price linkages to global commodity indices"; strategic plan financials, Bulk EBITDA 30 to 50 million in FY31; ">$40m of annual supply, procurement and logistics savings help partly mitigate inflation". announcements.asx.com.au
- Bega Group, announcement on the exit from primary peanut processing, 9 July 2025: "PCA has been incurring operating losses of $5-10 million per annum and following a shutdown these losses will cease." announcements.asx.com.au
- Ehrenberg-Bass Institute, "What happens when brands stop advertising?": "on average, sales fell 16% after one year, and 25% after two years"; "The data for this study tracked the media spend and volume sales of 70 competitive brands in an Australian consumer goods category for over 20 years." marketingscience.info
- McKinsey, "The dairy industry's 2026 playbook: Protect margins, pursue growth", 20 April 2026: "jointly surveyed 204 executives in the dairy industry (116 in the United States and 88 in Europe)"; "In the United States, nearly 70 percent of surveyed dairy companies reported flat or shrinking margins in 2025"; "a clear imperative: protect margins and execution in the near term, while investing selectively behind durable growth themes". mckinsey.com
Keep going
Pair this with the lessons and the free tool that teach the method behind it.
Playbook
Price rise or pack shrink. How to recover a cost rise through the list price or the pack size, and what each choice risks with shoppers and retailers.
More from the blog
Why 1 percent more in price beats 5 percent in volume. Why a list dollar from price reaches profit at so much higher a rate than a dollar from volume.
Why CPG promotions destroy value, and the three metrics that prove it. The same kind of bridge built for one consumer packaged goods (CPG) promotion rather than a whole year.
Eating the tariff. When a manufacturer absorbs a cost rise and when it passes it on, the other side of a cost bar.
Lessons inside the course
The manufacturer P&L →The P&L from list price to contribution, the keep rate, the six-bar profit bridge with no residual, and the three lenses for reading it, all used in this article.Start the lesson → VPM decomposition →How to split a change in sales into volume, price and mix, the finer view of this article's mix bar.Start the lesson → WTP and consumer value →Why willingness to pay, not cost, sets a price, and so which price bars a brand can earn again.Start the lesson →Try it free
Manufacturer P&L Sensitivity. This link opens it on its own biscuit example with a 2 percent list price rise, a 3 percent cost cut, 2 points of premium mix and 3 percent more volume from reasons other than price. Brand contribution then rises 11.5 percent. Its volume bar is negative because the tool assumes the retailer passes the list rise through to the shelf in full and counts the volume shoppers then give up. Set the cost change to zero to see a year with no new factory saving. Free and without sign-up.