When Price Adds Little, Mix Matters More to Profit
The way mix is counted can give the same year three different price figures.
The short version
- Price added little to growth in the latest results, so mix now accounts for more of the change in profit. At most big food and household companies, pricing added between nothing and about 2 percentage points to sales growth in the first half or the second quarter of 2026, and some, Unilever among them, are using promotions to win sales.12 Mix is the effect of selling a different combination of products, pack sizes and countries.
- Companies count mix in different places, so their volume and price figures are hard to compare. Nestle, Unilever and Danone count it in volume, PepsiCo (mostly) and Coca‑Cola in price; of the nine reviewed here, only Procter & Gamble reports it separately.
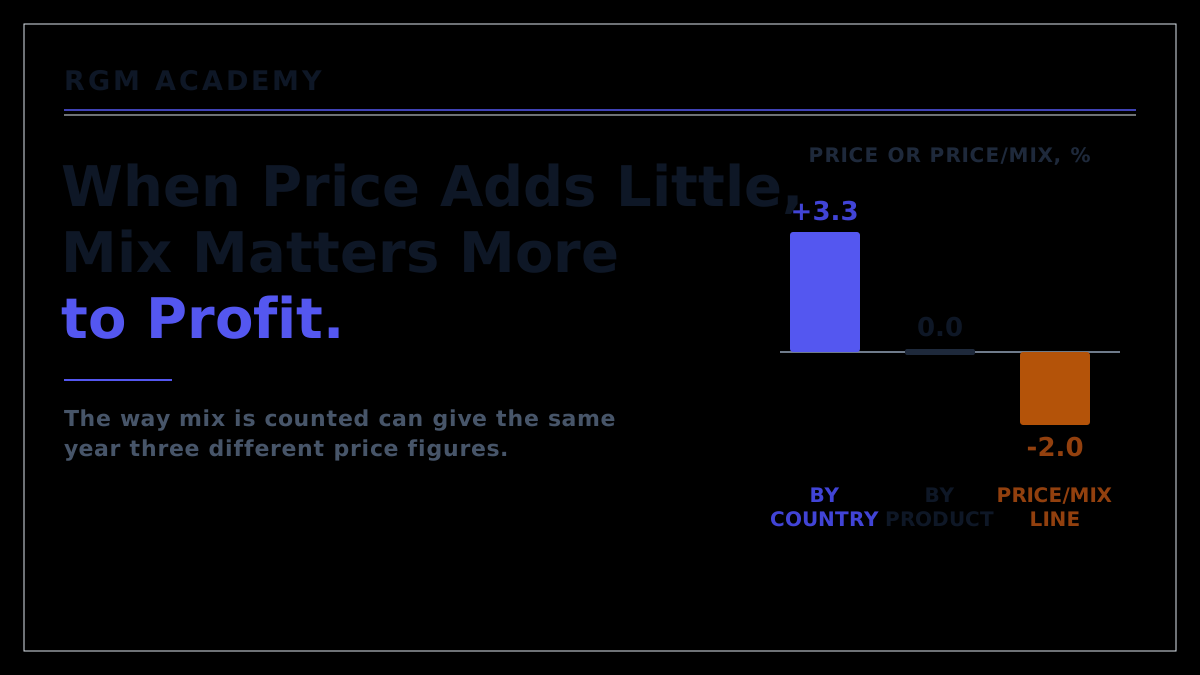
- Inside a company, the price figure depends on how the sales bridge (the split of sales growth into volume, price and mix) is built. In a worked example where no price changes, the price line reads +3.3 percent or zero, and a combined price/mix line reads -2.0 percent.
- Companies should write down how their bridge is built and run it on gross profit as well as sales. In a second example, a multipack promotion lifts the brand's sales by 10.5 percent but its gross profit by only 0.7 percent.
Where is growth coming from in 2026?
When PepsiCo reported its third-quarter 2026 results on 8 October 2026, it named "portion control, protein, fiber and simpler ingredients" among the fast-growing segments of its categories and said it was encouraged by its multipacks.3 Each of these is a change in what PepsiCo sells, which the industry calls mix, rather than a change in list price.
In results for the first half or the second quarter of 2026, pricing added little at most large food and household companies: 2.1 points at Nestle, 1.8 at Danone, 1.5 at Mondelez, 1.3 at Kraft Heinz and 0.6 at Unilever. At Procter & Gamble (P&G) it added nothing in the fourth quarter of fiscal 2026, April to June 2026.1 These figures measure the change in the net prices manufacturers receive; shelf prices are each retailer's decision.
Chocolate is the exception: Hershey's pricing added about 12 points in its second quarter of 2026.1 PepsiCo's effective net pricing added 3 points in the third quarter of 2026, but that measure includes mix. Unilever said its weaker price growth in the second quarter of 2026 was partly due to "planned FIFA World Cup 2026 promotional activity".2
When price adds almost nothing, volume and mix carry sales growth, and promotions that buy extra units also change which units are bought. General Mills said in September 2026 that it would use its revenue management toolkit "to strengthen price/mix, with a particular focus on mix".1
With price adding little, mix now accounts for more of the change in profit.
Where do companies put mix in their results?
Most companies split sales growth into a volume part and a price part, so mix sits inside one of them. Nestle's volume measure, real internal growth (RIG), is calculated product by product and channel by channel and then added up, so a shift toward more expensive products raises it; Nestle says RIG at group level "embeds the impact of the evolution of the product mix".4 Unilever's underlying volume growth includes "the composition of products sold".2 PepsiCo mostly does the opposite: its effective net pricing includes "mix resulting from selling varying products in different package sizes and in different countries", although product mix also affects its volume figure.3
Unilever called its second quarter of 2026 "the best volume quarter at Unilever in over a decade",2 but under its own definition the figure alone does not show how much came from selling more. In the same way, PepsiCo's effective net pricing can fall when it sells more in countries where each pack earns less, even if no price is cut. In the third quarter of 2026, volume added 11 points to its Asia Pacific Foods division's growth and effective net pricing took 2 points off.3
A fair comparison between companies starts from total organic growth (before acquisitions, disposals and currency) and reads each volume line as volume plus mix and each price line as price plus mix.
How can one year produce three different price figures?
The volume, price and mix (VPM) bridge
A sales bridge, also called price-volume-mix analysis, splits the change in sales into three effects, usually drawn as bars. The Academy writes it as the VPM identity: change in sales = volume effect + price effect + mix effect. The volume effect is the change in units, valued at the first year's average price. The price effect is the change in each item's price, applied here to the second year's units (the lesson applies it to the first year's). The mix effect is what is left: the effect of selling a different combination of items. What counts as an "item" is a choice, and each choice produces different bars.
An invented snack manufacturer shows this. Every pack weighs 100 grams, and no price changes between the two years. In country A it sells retailers a standard pack (the core pack) at 2.00 euros and a protein pack at 3.00 euros, both net prices after trade terms. In country B it sells only the core pack, at 1.00 euro. Country A sells 600 core and 100 protein packs in year one, and 540 core and 160 protein packs in year two, as some shoppers move to the protein pack. Country B's core packs rise from 300 to 420. Sales rise by 10.0 percent, from 1,800 euros (1,500 in country A and 300 in country B) to 1,980 euros (1,560 and 420). Packs sold are up 12.0 percent (1,120 against 1,000).
Three of the four readings start from the volume effect: 120 extra packs at year one's average price of 1.80 euros (1,800 euros divided by 1,000 packs) make 216 euros, 12.0 percent of 1,800. When the bridge is built pack by pack within each country, no price changed, so the mix effect is the rest of the 180-euro rise: minus 36 euros (180 less 216), or minus 2.0 percent. Mix is negative because the cheap extra packs in country B outweigh the shift to protein packs in country A. When the bridge is built country by country, it sees country A selling the same 700 packs in both years for 60 euros more, so it records the shift to protein packs as a price rise of 60 euros, or 3.3 percent. The Academy's VPM lesson calls this a phantom price. Mix then falls to minus 96 euros (180 less 216 less 60), or minus 5.3 percent. A single price/mix line combines the two into minus 36 euros, or minus 2.0 percent, which an analyst might read as falling prices.
Each version answers a different question, and few companies say which one their own bridge answers. FTI Consulting, an advisory firm, warns that a price calculated at product-group level "will likely have a layer of unquantified sales mix embedded".5
With no price changed, the same year shows price up 3.3 percent or unchanged, and a combined price/mix line down 2.0 percent, depending only on how the bridge is built.
What does a promotion do to the bridge?
A promotion spreads its effects across all three bars, and two of them can look like gains. The discount appears in price. Mix picks up the shoppers who switch from the brand's full-price packs to the promoted one, and volume picks up units bought early that would otherwise have been bought later. In a 2004 study of four sets of store data, about a third of a promotion's extra sales was borrowed from other weeks.6
Take a brand that sells retailers a 150-gram pack at 1.50 euros and a 450-gram multipack at 3.60 euros, both net prices after trade terms. The multipack is cheaper per kilo by design (8.00 euros a kilo against 10.00). The two cost 90 cents and 2.34 euros to make. In year one the brand sells 1,000 small packs and 100 multipacks. In year two it cuts the multipack's net price to retailers by 20 percent, or 72 cents, for a few weeks. How much of that reaches the shelf is the retailer's decision; the example assumes enough does for shoppers to switch. The brand sells 120 multipacks at the lower net price on top of the 100 at full price, and 100 fewer small packs.
The brand's sales rise by 10.5 percent, from 1,860 to 2,055.60 euros, but its gross profit by only 0.7 percent, from 726 to 730.80 euros. The 120 promoted multipacks earn 54 cents each (2.88 euros less the 2.34 cost), or 64.80 euros in all, while the 100 small packs no longer sold took 60 euros of gross profit with them, at 60 cents each. The net gain is 4.80 euros.
Volume looks better than gross profit: it rises by 20 percent in kilos (234 against 195) and by 1.8 percent in packs (1,120 against 1,100). At year one's prices, year two's packs would have sold for 2,142 euros (900 times 1.50 plus 220 times 3.60), 282 more than in year one. The discount is the price bar: 120 multipacks at 72 cents less, or minus 86.40 euros, which brings the 282 back to the actual rise of 195.60.
The 282 is volume plus mix, and the unit decides the split. Counted in packs, the 20 extra packs at year one's average of 1.69 euros (1,860 divided by 1,100) explain 34 euros of the 282, leaving mix at plus 248 euros, or 13.3 percent of year one's 1,860. Counted in kilos, the 39 extra kilos at 9.54 euros a kilo (1,860 divided by 195) explain 372 euros, leaving mix at minus 90 euros, or minus 4.8 percent.
Why packs and kilos give opposite answers
A larger pack usually sells for less per kilo, so a move into it raises sales per pack and lowers sales per kilo, which is positive mix counted in packs and negative mix counted in kilos. The unit is a setting someone chose in the finance system, and it decides whether a move into bigger packs counts for or against the team that manages them.
A promotion can lift sales, volume and mix while earning almost no gross profit, so it should be judged on gross profit across all the brand's products.
Is premium mix earning more gross profit?
Often it earns less than the sales figures suggest. In the snack example, suppose the protein pack earns a gross margin of 35 percent (gross profit as a share of the net price) and the core pack 45 percent. A protein pack earns 1.05 euros (35 percent of 3.00) and a core pack 90 cents (45 percent of 2.00). On the sales bridge, each pack that switches is worth the difference in price, 1.00 euro. On the profit bridge, it is worth only the difference in gross profit, 15 cents. In country A, the 60 packs that switch add 60 euros to sales, 4.0 percent of 1,500, but only 9 euros to gross profit, 1.4 percent of 645 (600 core packs at 90 cents plus 100 protein packs at 1.05 euros).
The Academy's mix lesson measures the same shift as the mix effect on margin: actual blended margin less the blended margin at the prior period's mix. With no price or cost changed, country A's gross margin is 43.0 percent at year one's mix (645 divided by 1,500) and 41.9 percent at year two's (654 euros, the 645 plus the 9, divided by 1,560). The mix effect is minus 1.1 points (41.9 less 43.0), while gross profit rose. P&G's figures show a similar gap. In its fourth quarter of fiscal 2026, its sales table showed mix at zero, while its core gross margin bridge showed "120 basis points of unfavorable product mix", or 1.2 percentage points, the largest negative item in that bridge.7
Protein, one of the fast-growing segments PepsiCo named, also faces steep cost increases: the price of whey protein concentrate rose by 60 percent in 2025 and by another 76 percent by June 2026.8 If the protein pack's cost rises by 15 cents in year two, it too earns 90 cents and the shift adds nothing. Country A's 700 packs then earn 630 euros (700 times 90 cents), 2.3 percent less than in year one, the same as if no shopper had switched. Whether the manufacturer can raise the protein pack's list price depends on the value shoppers see in it against the alternatives on the shelf; its cost sets only a floor, and the shelf price remains each retailer's decision.
A shift to premium products adds only their difference in gross profit, which rising costs can erase.
How should a company build its bridge?
The most detailed bridge, built product by product, has a problem of its own: a new item has no price in the previous year. A relaunch at a higher price per kilo, or a smaller pack sold at the old price, counts as a new item, so the price rise inside it is recorded as volume and mix. Nestle counts new launches "from the moment of launch which tends to increase RIG".4
A bridge therefore needs a written rule for new and changed items. Its method should be written down too: the level at which it is calculated (product, channel and customer), the unit volume is counted in (ideally the one costs follow, often kilos or liters in food and drink), and a separate line for promoted prices. Re-running the previous year's bridge in total, by country and by product shows how much the price figure depends on the method. As a rough test, if it moves by more than half a point between methods, the headline price figure is carrying mix.
Bigger packs and promotions are sometimes the right choice: a multipack that counts as negative mix in kilos can still raise gross profit per shopping trip, and a promotion that brings in new households may earn its cost back later. Sales targets, including those of the key account managers who handle promotion funding with retailers, should allow for this. Setting them in gross profit, or with a floor on gross profit per kilo or per liter for each pack size, stops the packs and promotions that earn the least from being the easiest way to hit them.
Price growth may recover: in July 2026 Unilever said it expected its underlying price growth "to accelerate in the second half" of 2026.2 Even then, where mix is counted would still decide what the price line shows.
A bridge whose method is written down, and which is run on gross profit as well as sales, shows whether the mix a company reports is earning anything.
References
- Company results releases, July to October 2026, the latest published in October 2026: Nestle half-year 2026 (pricing 2.1 percent); Danone first half 2026 (price 1.8 percent, volume/mix 1.7); Mondelez second quarter 2026 (pricing 1.5, vol/mix 0.7); Kraft Heinz second quarter 2026 (price 1.3, volume/mix -2.6); Unilever first half 2026 (price 0.6, volume 4.2); Procter & Gamble fourth quarter fiscal 2026 (price 0, mix 0); General Mills first quarter fiscal 2027 (price/mix flat; earnings call: "And we'll leverage our Strategic Revenue Management toolkit to strengthen price/mix, with a particular focus on mix."); Coca-Cola second quarter 2026 and Conagra first quarter fiscal 2027 (price/mix lines); Hershey second quarter 2026 ("net price realization of approximately 12 points"). Nestle, Danone, Mondelez, Kraft Heinz, Unilever, P&G, General Mills release, General Mills call, Coca-Cola, Conagra, Hershey
- Unilever, first-half 2026 results, 28 July 2026: underlying volume growth includes "the composition of products sold"; second quarter of 2026 "the best volume quarter at Unilever in over a decade"; price growth lower partly on "planned FIFA World Cup 2026 promotional activity"; "We expect underlying price growth to accelerate in the second half as commodity-driven pricing continues to land in market". unilever.com
- PepsiCo, third-quarter 2026 earnings release and prepared management remarks, 8 October 2026: effective net pricing up 3; Asia Pacific Foods organic volume up 11 with effective net pricing down 2; effective net pricing defined to include "mix resulting from selling varying products in different package sizes and in different countries", while the organic volume change can also differ from unit volume "due to the impacts of product mix"; "fast growing segments of our categories which include - portion control, protein, fiber and simpler ingredients"; encouraged by "the scale of our Multipack offerings". earnings release, prepared remarks
- Nestle, Alternative Performance Measures, February 2026: real internal growth is calculated "at the level of the individual product reference (stock keeping unit) per distribution channel" and at group level "embeds the impact of the evolution of the product mix"; new launches are included "from the moment of launch which tends to increase RIG". nestle.com
- FTI Consulting, "A Quantifiable Approach to Price Volume Mix Analysis": price-volume-mix analysis should be calculated at SKU level, because at product-group level "the Price variable will likely have a layer of unquantified sales mix embedded within the resulting output". fticonsulting.com
- Harald van Heerde, Peter Leeflang and Dick Wittink, "Decomposing the Sales Promotion Bump with Store Data", Marketing Science 23(3), 2004, four store datasets: cross-brand switching, cross-period effects and category expansion "each of these three parts contribute about one third on average", with category expansion split further into cross-store and market-expansion effects. doi.org
- Procter & Gamble, fourth quarter and fiscal year 2026 results, 29 July 2026: fourth-quarter Mix column 0 percent; core gross margin unchanged as productivity savings were offset by items including "120 basis points of unfavorable product mix". pg.com
- CBC News, 6 October 2026: whey protein concentrate (WPC80) "rose 60 per cent in 2025. By June 2026, buyers were facing another 76 per cent increase." cbc.ca
Keep going
Pair this with the playbook and the lessons that teach the methods behind it.
Playbook
End or shrink a promotion. A five-question guide to telling which promotions to kill and which to make smaller. A full promotion bridge, in packs, kilos and gross profit, should guide this decision.
More from the blog
How promotions destroy value. The three numbers that show whether a promotion paid back, and how to read its true incremental gross profit.
The squeezed middle. What happens to your mix when the middle price tier empties and shoppers split between value and premium.
The K-shaped consumer. The income split that empties the middle of the shelf, and why managing to the average hides a mix problem.