Why the Last Promotion in the Plan Earns the Least: The Case of Conagra
A promotion plan's average return can look healthy while its last events lose money.
The short version
- On 30 September 2026 Conagra Brands said it had stopped repeating some promotional events on one brand, accepting lower sales for higher profit.12
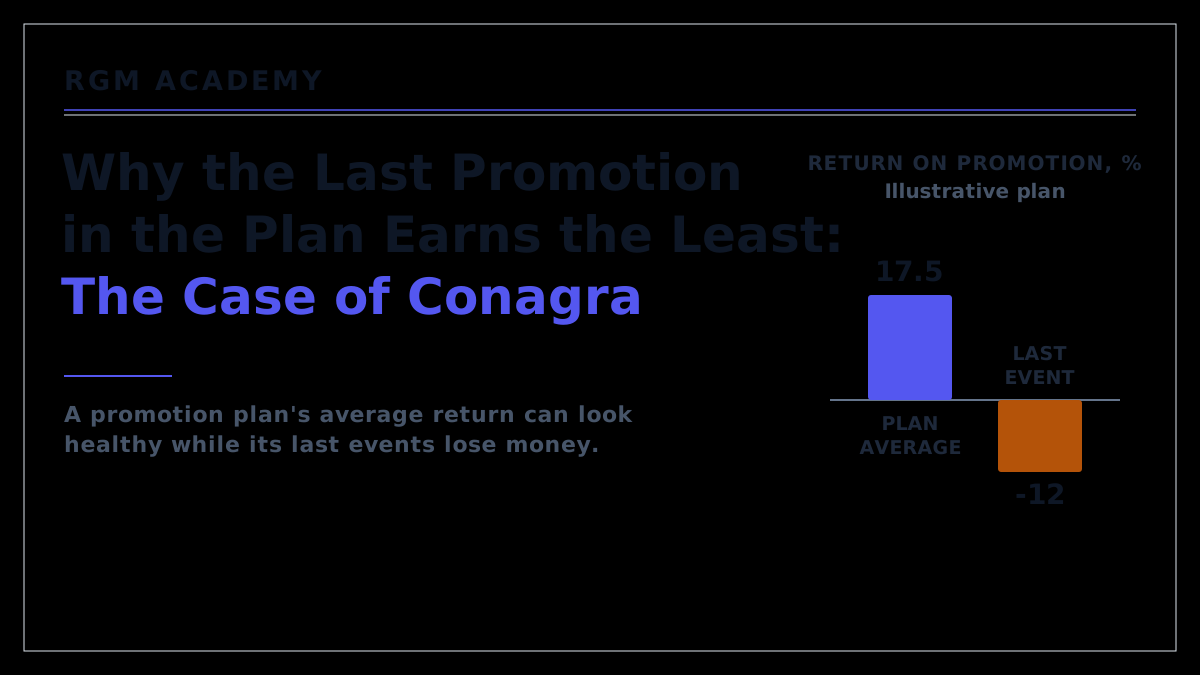
- A promotion plan's average return describes money already spent; the next dollar depends on the returns of the weakest event funded and the best event not funded. In the worked example below a plan averages 17.5 percent while its last event loses 12 percent.
- The last events in a plan tend to earn the least, because the best events are funded first.
- Moving money from the weakest funded event to the best unfunded one gains, on every dollar moved, the difference between their returns. In the example the same 1,000,000 dollars earns 320,000 dollars instead of 175,000.
- The plan is finished when no unfunded event earns more than the weakest funded one. One cut-off, the lowest return an event must earn to be funded, applies at every retailer and starts at break-even.
What did Conagra change in its promotions?
On 30 September 2026, reporting the first quarter of its fiscal 2027, Conagra Brands, an American maker of packaged foods, said it had "opted not to repeat certain merchandising events" on its Sandwich Bros brand, "which resulted in top line headwinds but improved profitability".1 Merchandising events are the promotions a manufacturer pays a retailer to run: temporary price cuts, features in the retailer's advertising and displays in store. Asked on the call whether more such decisions would follow, the chief executive, John Brase, said the company would not "repeat promos that have been dilutive to the company", meaning promotions that lowered its profit. He added that the effect was already "embedded into the fiscal year forecast".2
Conagra added promotion money in the same quarter. Its merchandising spending rose across the company while particular events came out, and it raised advertising and promotion (A&P) spending by 15 percent.1 A&P sits in its selling costs rather than in payments to retailers. It did not say that money moved from one brand to another.
Conagra dropped promotions that cost it profit while its merchandising and advertising spending rose in the same quarter, so its promotion money as a whole was not cut.
Why does the average return hide the weakest events?
The Academy's lesson on promotion investment allocation observes that almost every trade review reports one return on investment (ROI) per retailer. The lesson calls this the average return and sets it against the marginal return: "The average return tells you how the money you already spent performed. The marginal return tells you what the next dollar will earn."
Average return and the next dollar
Average return = total net profit from all funded events divided by total money spent. Marginal return, looking back = the return of the last event funded: what a cut would save or lose first. Marginal return, looking forward = the return of the best event not funded: what more money would earn. The lesson's advice: "Ask for the event list sorted by return, and read the bottom of it."
In an illustrative worked example, a salty snack manufacturer spends 1,000,000 dollars on seven events at Retailer A. Each event's return is its net incremental profit divided by the money spent on it, so break-even is zero. Net incremental profit is the manufacturer's own margin on genuinely new units, counted on its net price rather than on the shelf price, less the discount paid on every unit sold on deal and the sales lost in the weeks after. The manufacturer decides which events it funds; the promoted shelf price is the retailer's decision.
Sorted by return, the first five events earn 60, 45, 33, 20 and 10 percent. Their budgets are 100,000, 120,000, 150,000, 150,000 and 130,000 dollars, 650,000 dollars in all. The last two lose 5 percent on 150,000 dollars and 12 percent on 200,000 dollars. Total profit is 175,000 dollars (60,000 plus 54,000 plus 49,500 plus 30,000 plus 13,000, less 7,500 and 24,000). The average return is 17.5 percent (175,000 divided by 1,000,000), which looks acceptable until the list is read from the bottom.
The lesson's return on the last slice of a budget is the change in profit divided by the change in spend. The top five events alone earn 206,500 dollars, so the last 350,000 dollars lost 31,500 dollars (175,000 less 206,500). Its return is minus 9.0 percent (31,500 divided by 350,000). A third of the budget lost money inside a plan that averaged 17.5 percent.
Kraft Heinz's published promotion returns are plan-wide readings. On 5 August 2026 it told investors that its "Return on Promotions" rose 3.4 points and its "% of Promotions with net positive ROI" 6.6 points between the first halves of 2025 and 2026.3 The closest measures in the Academy's lesson on the promotion performance grid are the portfolio return and the portfolio efficiency ratio, although Kraft Heinz's presentation does not say how it defines them. Neither reading says which event to drop next.
A plan's average return describes money already spent, so a manufacturer should sort its events by return and judge the plan by the bottom of the list.
Why do the last events in a plan earn the least?
The investment allocation lesson draws a plan as a response curve, profit against money spent, which "bends because you fund the best events first and the list gets worse". Each extra event at the same retailer also tends to win fewer genuinely new sales: more of its volume goes to shoppers who would have bought anyway, some is bought early and stored at home, and frequent deals can lower the price shoppers expect to pay.
A public Nielsen benchmark from 2014 shows the same pattern for the depth of discount. Trade efficiency is Nielsen's measure of trade return per dollar invested. Categories that used deep discounts (more than 25 percent off) on a small share of their events had the highest, 74.3 percent. Where every event was a deep discount, it was 37.0 percent, half as much (37.0 divided by 74.3 is 49.8 percent).4 The data compare categories rather than events within one plan, but the shape matches the curve.
Nielsen's improving categories cut their share of deep-discount events by 39.2 percent and gained 3.6 points of trade efficiency. The categories losing ground raised that share by 21.4 percent and lost 8.5 points. Both groups ran slightly more events (2.8 and 2.5 points more, on Nielsen's measure), so what separated them was the depth of discount: the winners ran shallower discounts more often without shrinking the calendar.4
In 2026 several manufacturers are adding promotion money, and each added event sits further down its plan's curve. Kraft Heinz told investors it was "Increasing investments in price and driving stronger returns on promotions",3 and General Mills said in July 2026 that shoppers were "buying more on promotion and less at everyday prices".5
The last events in a plan tend to earn the least, so a growing promotion budget makes the return on the next dollar more important.
Where should the money go, and when should it stop moving?
Dropping the two losing events would raise profit by 31,500 dollars and cost their volume at Retailer A. The better question is where the money would earn more.
One cut-off, everywhere
Gain from moving one dollar = the return of the event it buys minus the return of the event it cancels, exact when the two events cost the same. Funding gap = the best unfunded event's return at one retailer minus the weakest funded event's return at another; money keeps moving while the gap is positive. Cut-off = the lowest return an event must earn to be funded, the same at every retailer. It starts at break-even and rises to "the return your next-best use of the money would earn" only when that use, such as advertising, has a measured return.
A second retailer, Retailer B, has events nobody funded: a display that would cost 150,000 dollars and return 41 percent, a multibuy at 200,000 dollars and 26 percent, and a price reduction at 120,000 dollars and 8 percent. Retailer A has no better version of its plan on offer at the same spend.
Canceling the 200,000-dollar event at minus 12 percent and funding the multibuy gains 76,000 dollars (200,000 times 38 percent, the gap between 26 and minus 12). Canceling the 150,000-dollar event at minus 5 percent and funding the display gains 69,000 dollars (150,000 times 46 percent, the gap between 41 and minus 5). The same 1,000,000 dollars now earns 320,000 dollars (175,000 plus the two gains), an average return of 32.0 percent. The gain comes from moving the money, since no event was run better.
Before the moves the funding gap was 53 points: Retailer B's best unfunded event at 41 percent against Retailer A's weakest funded one at minus 12. After them, the best unfunded event is Retailer B's price reduction at 8 percent and the weakest funded one is Retailer A's 10 percent event. The gap is minus 2 points (8 less 10), so the plan is finished.
The cut-off also stops a manufacturer from dropping events just to raise the average. Dropping the 10 percent event as well would lift the average return to 35.3 percent (320,000 less 13,000, divided by the remaining 870,000) while profit would fall by 13,000 dollars. The event stays unless the money has another use with a measured return above 10 percent.
Money should move from the weakest funded event to the best unfunded one until no unfunded event earns more than any funded one. The cut-off stays at break-even until another use of the money has a measured return.
What if dropping an event costs share or the retailer's goodwill?
The strongest objection is that an event's return understates what it does: drop it and a rival may take the slot, the retailer may push back, and lower volume may raise unit costs in the factory. The method moves money rather than cutting it, and Nielsen's improving categories ran slightly more events while cutting deep discounts. Costs that are real belong in the return: if lost volume raises unit costs, that cost goes into the event's net profit and the event is ranked again.
The lesson allows an event below the cut-off on four conditions: "Name what it is buying, specifically", "Time-box it" (give it an end date), "Say what it must prove" and "Price it". "Building the relationship does not qualify."
Estimates are uncertain too. A 3 percent error in the baseline, the sales the product would have made without the event, can move a 50 percent return by about 18 points, the lesson shows. Retailer B's events are forecasts for events that have not run. If both were 18 points worse than estimated, the moves would still gain 82,000 dollars (200,000 times 20 percent plus 150,000 times 28 percent, the 38- and 46-point gaps each less 18).
For the retailer losing the events, the lesson's advice is to "Bring the events, not the total" and to "Offer the substitution before the reduction", meaning a better plan at the same spend, if one exists. In the example none does, so Retailer A's budget falls by 35 percent (350,000 of its 1,000,000 dollars), a cut the lesson would phase over more than one year where the relationship needs it.
Conagra has put the volume it gave up into its forecast for fiscal 2027. Such a decision rests on five steps: put a return on every event, sort the list, read the bottom, compare it with the best event nobody funded, and move the money while the gap is positive.
An event below the cut-off should be dropped or its money moved unless it buys something named, for a fixed time and at a stated price, and the volume it carried should be agreed in the forecast before it goes.
References
- Conagra Brands, First Quarter Fiscal 2027 Earnings Pre-Recorded Remarks, 30 September 2026: "In addition, we took actions to improve profitability on brands like Sandwich Bros, where we opted not to repeat certain merchandising events, which resulted in top line headwinds but improved profitability."; "In Q1, we increased A&P investment by 15%"; "Price/mix contributed 130 basis points to margin, with inflation-justified pricing actions more than offsetting incremental merchandising investments."; "Adjusted SG&A, which includes advertising & promotion expense". conagrabrands.com
- Conagra Brands, first quarter fiscal 2027 question-and-answer session, 30 September 2026, third-party transcript of the call: question, "Is that the kind of thing that we will be seeing throughout the year, that there'll be promotions that you already see that were not effective from a profitability standpoint?"; answer (John Brase, chief executive), "we're not going to repeat promos that have been dilutive to the company." ... "all those assumptions have been embedded into the fiscal year forecast." stockanalysis.com
- Kraft Heinz, second quarter 2026 business update, 5 August 2026: "Increasing investments in price and driving stronger returns on promotions"; "Return on Promotions: +3.4pp vs H1 2025"; "% of Promotions with net positive ROI: +6.6pp vs H1 2025". seekingalpha.com
- Nielsen, "How Do Your Promotions Compare with Best-in-Class?", presented to the Promotion Optimization Institute, November 2014; Nielsen Trade Promotion Benchmark Database, third quarter of 2014, 211 categories: average category trade efficiency by the share of events promoting deeper than 25 percent (0%, 69.0; 0 to 5%, 74.3; 5 to 25%, 60.6; 25 to 50%, 53.2; 50 to 100%, 40.8; 100%, 37.0); "Decreasing depth of discount while increasing frequency is working for some"; improving categories "+3.6 pts." trade efficiency, "+2.8 pts." events, "-39.2%" deep-discount share; categories getting off track "-8.5 pts.", "+2.5 pts." events, "+21.4%"; "Trade Efficiency = Trade Return / Dollar Invested"; "Manufacturers pay 80% of Discount". poinstitute.com
- Food Business News, on General Mills' fiscal 2026 results, July 2026: "And as consumers remained pressured, we saw them buying more on promotion and less at everyday prices, driving a less profitable mix of volume through our P&L." foodbusinessnews.net
Keep going
Pair this with the playbook and the lessons that teach the methods behind it.
Playbook
End or shrink a promotion. How to decide whether a weak event should end or run smaller, the step before deciding where its money goes next.
More from the blog
The case for ending half your promotional plan. Five questions that sort a calendar into events to end and events to shrink; this article adds where the money should go instead.
Why promotions destroy value, and the three metrics that prove it. The measures that put a true return on each event, the input every ranked list needs.
Why BOGO is dying, and what works instead. One mechanic whose extra volume is mostly bought early by loyal shoppers, and the mechanics that do better.
Lessons inside the course
Promo investment allocation →Average return against the next dollar, the response curve, one cut-off for every retailer, when to stop spending, and how to put a reallocation to the retailer losing events.Start the lesson → Promo performance grid →The portfolio return and the share of events that pay, the plan-wide readings a company can publish, and why they can point in opposite directions.Start the lesson → Promo ROI fundamentals →How to put a return on one event, from the genuinely new units, the discount paid on every unit sold on deal and the dip that follows.Start the lesson →Try it free
Promo ROI Calculator: an event that loses money. Opens on a two-week deal at 20 percent off, on the calculator's own example pack, where only 30 percent of the extra units are genuinely new and sales dip for two weeks afterwards. Free and without sign-up.
Promo ROI Calculator: an event that pays. A shallow deal, 8 percent off, that lifts sales 2.5 times, where 60 percent of the extra units are new and the dip is small. Put a return on each of your own events this way, then sort the list. Free and without sign-up.