How Much of a Deal Event's Extra Volume Is Really New: The Case of Amazon's October Sale
One retailer's deal-week uplift overstates growth until store switching and the dips come out.
The short version
- Amazon, Target and Walmart each ran a deal event in the week of 5 October 2026, and more than half of Amazon's event shoppers compared prices at other retailers first.
- The Academy's net incremental volume formula takes cannibalization, store switching and the dips before and after out of one retailer's uplift. Store switching, the brand's own shoppers buying it in a different store, is the step one retailer's data does not show.
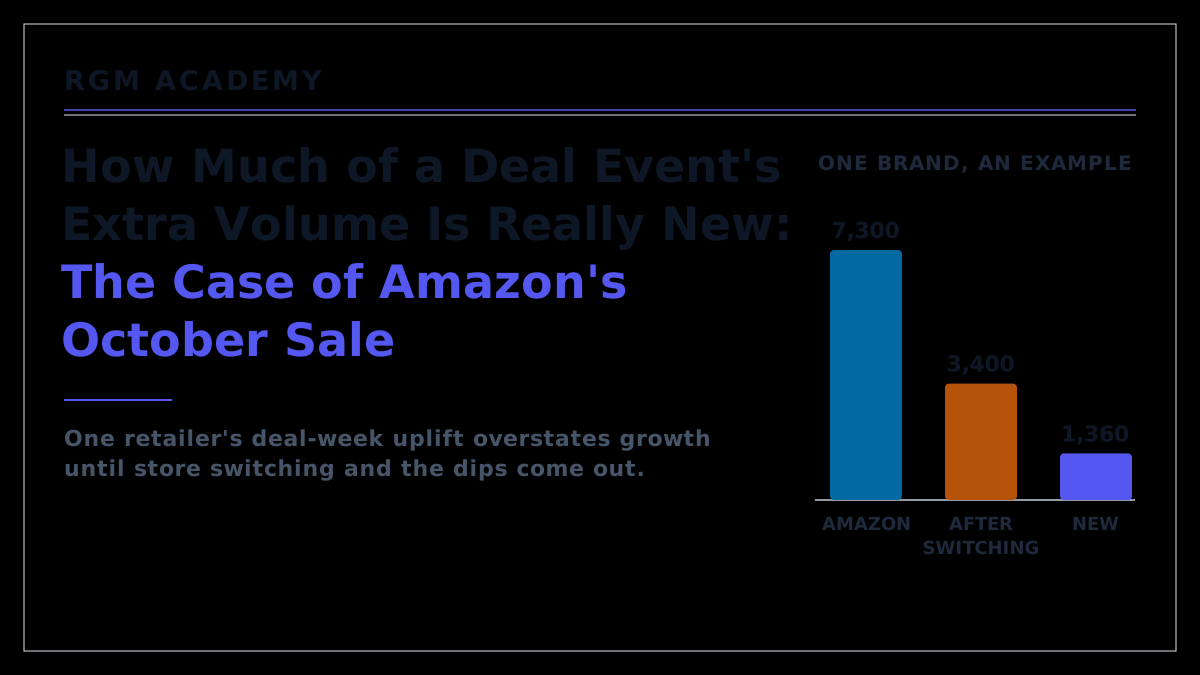
- In a worked example, 7,300 extra units at Amazon leave 1,360 that are new to the brand. The brand paid 1.00 dollar of funding a unit against 3.00 dollars of gross profit a unit, so the event needed 33.3 percent of its deal volume to be new (1.00 divided by 3.00). It got 7.9 percent, a loss of 13,220 dollars.
- Before the holiday plan is signed, a manufacturer should read its sell-out at every retailer, set a break-even bar for each event and measure the dips up to the next event.
What did the October 2026 deal week show?
Amazon ran its Prime Big Deal Days on Tuesday 6 and Wednesday 7 October 2026.1 Target scheduled its Circle Deal Days on the same two days, and Walmart ran its own Deals event from 5 to 11 October 2026.23 Each retailer announced its own dates and chose its own deal prices.
Numerator, which tracks household purchases, read the first day this way, as Supermarket News reported it: household spending at Amazon rose 48 percent against an average Tuesday. That was "more than three times the lift Walmart recorded on the first day of its sale", and "Target saw no lift".4 In its final update on 8 October 2026, which it calls an early read, Numerator found that 55 percent of the event's shoppers had compared prices and products at other retailers before buying on Amazon.5
Adobe put US online spending at all retailers during the two days at 9.86 billion dollars, 8.5 percent more than in 2025, and personal care sales 73 percent above September 2026, as reported by Digital Commerce 360.6 Neither figure says what a brand gained: the first covers the whole online market, and the second is measured against September 2026, not against a brand's normal week.
Three retailers ran deals in the same week and most of Amazon's event shoppers looked elsewhere first, so a brand's uplift at one retailer can include its own sales moving between stores.
What does the Academy's formula take out?
The Academy's lesson on source of volume starts from the uplift, the units sold above the baseline (the brand's normal week), and takes out, one at a time, the units that were not new to the brand.
Net incremental volume, and the two shares it gives
Net Incremental Volume = Uplift - Cannibalization - Store Switching - Dip After - Dip Before + Halo. Cannibalization is the sales the brand's own other packs lost. Store switching is the brand's own shoppers buying it at the promoting retailer instead of another one. The dip after is shoppers who stocked up and buy less later; the dip before is shoppers who waited for the deal. Halo is extra sales of the brand's other products, which the lesson adds "only when measured". Two shares follow, and they answer different questions. The net share of uplift divides net incremental volume by the uplift: of the extra units, how many were new? The lesson's rule of thumb calls anything under 50 percent unproductive. Incrementality divides it by everything sold on deal, the baseline included: of all the units the brand paid to discount, how many were new?
The lesson describes store switching as "your own brand pulled from another retailer: the retailer gains, you stand still", and measures it as Store Switching Volume = Uplift at Promoting Retailer - Total Market Uplift for Your Brand. The total market uplift comes only from the brand's own sell-out, its sales to shoppers, at every retailer.
Two published benchmarks say little about this step. The authors of a 1999 study of household purchases in 13 categories wrote: "we do not attempt to address store switching".7 A 2004 study with store data split the uplift, which it calls the bump, into about three equal parts, one of them category expansion. Its authors split that part further in only one category, tuna, where shoppers switching stores were 25 percent of the bump and new demand 6 percent, an estimate they call "quite unreliable".8 For a manufacturer, part of that category expansion, usually counted as new, can be its own brand moving between stores.
Of the formula's deductions, store switching is the one a retailer's report does not show, and the usual benchmarks either leave it out or count part of it as growth.
How much of 7,300 extra units is new?
Take an invented personal-care brand that normally sells 10,000 units a week on Amazon. In the event week it sells 17,300, an uplift of 7,300 units, or 73 percent (7,300 divided by 10,000), a figure chosen to echo Adobe's for illustration only.
The brand's other packs lose 400 units at Amazon that week, which leaves 6,900. Its own sell-out at all its retailers, Amazon included, shows a whole-market uplift of 3,800 units, so 3,500 units moved between stores (7,300 less 3,800). That is a store switching rate of 47.9 percent (3,500 divided by 7,300), and it leaves 3,400. The example assumes the brand funded no deal at its other retailers that week. Its rate sits between the 25 percent the tuna study found and the 60 percent in the lesson's own example of an exclusive deep deal. At 25 percent, on the dips and the money set out below, 3,035 units would be new and the event would still lose 8,195 dollars (3,035 times 3.00 dollars of gross profit, less 17,300 of funding).
Measured from the announcement to the next event, shoppers who stocked up buy 1,200 fewer units afterwards, and shoppers who waited for the deal bought 840 fewer before it. Together the dips take 2,040 units, 27.9 percent of the Amazon uplift (2,040 divided by 7,300). That is close to the third of the bump the 2004 study reports for the dips.8 No halo was measured, so it counts as zero.
Net incremental volume is 7,300 - 400 - 3,500 - 1,200 - 840 + 0 = 1,360 units. Of these, 680 came from rival brands, 340 from shoppers new to the category and 340 from existing shoppers using more. The net share of uplift is 18.6 percent (1,360 divided by 7,300), well under the lesson's 50 percent line. Incrementality is 7.9 percent (1,360 divided by 17,300).
The Academy's free Source-of-Volume Decomposer has no inputs for cannibalization, store switching or the dip before, so the link under Keep going enters the 3,400 units left and puts both dips in its pantry-loading slider, the tool's input for shoppers who stock up. It shows the same 1,360 new units.
In the example, more than four in five of the extra units at Amazon came from sales the brand would have made anyway, and store switching was the largest single deduction.
Did the event pay?
The brand's Net Sales on a unit, what Amazon pays it after everyday trade terms, is 6.00 dollars. Cost of goods sold (COGS) is 3.00 dollars, so a unit sold at full price earns the brand 3.00 dollars of gross profit. For the event the brand funds 1.00 dollar of its own promotion money on every unit Amazon sells on deal. The deal price shoppers see is Amazon's decision.
The bar the event has to clear
Break-even Incrementality = Discount per Unit / Regular GP per Unit + Fixed Event Costs / (Promoted Volume x Regular GP per Unit), where GP is gross profit at the regular price. Each new unit earns the full 3.00 dollars, and every unit sold on deal, new or not, costs the 1.00 dollar of funding, which is the discount per unit in the formula. So the event pays only if the new units are at least a third of everything sold on deal: 1.00 divided by 3.00 = 33.3 percent, before any fixed event cost. With 2,000 dollars of extra advertising the bar rises to 37.2 percent (2,000 divided by 51,900 dollars of gross profit on 17,300 units at 3.00 dollars = 3.9 points). The lesson's point is that "the bar moves with the discount, so no single figure works for every event".
The Academy's lesson on promotion return values the new units at full-price gross profit and charges the funding once: net incremental profit = incremental gross profit - funding. The funding is 17,300 dollars (1.00 dollar on 17,300 units), 10,000 of it on baseline units that would have sold at Amazon anyway. The new units earn 4,080 dollars (1,360 times 3.00). Net incremental profit is a loss of 13,220 dollars (4,080 less 17,300), a return of minus 76.4 percent (13,220 divided by 17,300).
Read at the Amazon uplift, 42.2 percent of the units sold on deal were new (7,300 divided by 17,300), which clears the bar and shows a profit of 4,600 dollars (21,900 of gross profit less the 17,300 funding). The headline profit and the loss across the market are 17,820 dollars apart (4,600 plus 13,220). Store switching accounts for 10,500 of it (3,500 units at 3.00 dollars). A careful one-store reading that took out cannibalization and both dips, but could not see store switching, would still find only 4,860 new units, 28.1 percent of everything sold on deal and under the bar. The loss would be 2,720 dollars (4,860 times 3.00, less 17,300).
Turned around, the bar shows what the brand could have afforded to fund on each unit at these volumes: incrementality times gross profit. That is about 24 cents a unit at the market reading (0.079 times 3.00), against 1.27 dollars at the headline (0.422 times 3.00).
A third reading sits between the 7,300 the brand's Amazon account sees and the 1,360 it keeps across the market. Read from inside one store, the way the lesson describes a retailer's view, shoppers won from other stores count as new and switches between brands on the store's own shelf do not. On that reading the event added 4,180 units to Amazon's category (3,500 from other stores, 340 new to the category and 340 from shoppers using more), if all 680 units won from rival brands were won on Amazon's own shelf. It is the lesson's reading, not a figure Amazon reports, and with the 7,300 it shows why the lesson says one store's report "reads better than the market does".
Valued at full-price gross profit, the event cost the brand 13,220 dollars; store switching was the largest part of the gap between the headline profit and that loss, and even without it the event would have missed the bar.
Why does the dip not end with the event?
Amazon announced its dates on 14 September 2026, offered early deals before the event, and lets shoppers set a target price and have Alexa buy when the price drops to it.1 At its June 2026 Prime Day, Numerator found that "nearly half of shoppers reported purchasing an item they had been waiting to buy until it went on sale".9 If some shoppers were already waiting in September 2026, Adobe's September 2026 base makes the event look larger: that would be the dip before at work.
What sold most was storable: Numerator's top sellers included Premier Protein shakes, Lysol wipes, Scott toilet paper and Dawn Powerwash spray.5 On the first day, 27 percent of shoppers said they used the sale to offset price increases, against 14 percent a year earlier.4 A shopper who fills a cupboard during the event buys less in the weeks after, and the brand has already paid its funding on those units. The event also borrows from the holidays themselves: a fifth of Numerator's participants bought holiday gifts. Of those, 18 percent finished more than half of their gift shopping during the sale, about 3.6 percent of all participants (0.20 times 0.18).5
The window after the event is short. Amazon's Holiday Beauty Event runs from 19 October to 1 November 2026, with personal care up to 40 percent off on its last two days.10 That leaves 11 days, 8 to 18 October 2026, in which the dip after one event and the dip before the next overlap. The Academy's lesson on baselines starts from the average of the last 8 to 12 weeks without a promotion. For the Holiday Beauty Event those weeks would include the October 2026 sale, its dips and any wait before it. Adobe expects retailers to bring their pre-holiday promotions forward, Digital Commerce 360 reported, which would crowd the calendar further.6
The dips belong to the full window from the announcement to the next event, and in a crowded calendar a one-week read after the event can miss much of them.
What should a manufacturer check before the holiday plan is signed?
The strongest objection is that the brand had no real choice. If it does not take part in Amazon's October 2026 event, a rival takes the deal slot and the brand's sales at Amazon that week fall; taking part may also lift the brand's ranking on Amazon afterwards. That is a fair correction to the baseline: if a rival on deal would have cut the brand's sales that week to 9,000 units, the uplift is 8,300 (17,300 less 9,000), and the review should use it. On that baseline 2,360 units are new (1,360 plus the 1,000 the brand kept from the rival), and the event still loses 10,220 dollars (2,360 times 3.00, less 17,300). Store switching stays at 3,500, because those units are still the brand's own sales moving between stores. A ranking effect is a halo, which the formula adds once it is measured.
The lesson also lists reasons to fund store switching on purpose, such as building share at a retailer that matters to the brand. In the example the 3,500 switched units took 3,500 dollars of the brand's funding (1.00 a unit) and added nothing across the market, while counting them as new made the event look 10,500 dollars better than it was. A review that knows both figures can decide whether the share they built at Amazon is worth it.
Three habits make the decision visible before the money is committed. The first is the cross-retailer check, on the brand's own sell-out at every retailer for the event week and the weeks around it. The second is a break-even bar for each event, set from the funding and the margin. The third is reading the dips over the full window, up to the next event. A manufacturer can offer every retailer the same funding terms for the same weeks; that is its own decision. Whether shoppers then have less reason to move depends on each retailer, which decides whether to run a deal and how deep, and in October 2026 the lifts in one week differed widely.
A deal week can still be worth funding, on net incremental profit across the brand's whole market over the full window, and on any switching the brand chose to pay for on purpose.
One retailer's uplift is the start of the calculation, and a manufacturer that measures store switching and the dips before it funds the next event knows what its deal money buys.
References
- Amazon, "Amazon's Prime Big Deal Days returns October 6-7", published 14 September 2026, updated 6 October 2026: "kicking off the season with 48 hours of Prime member-exclusive deals across more than 35 categories"; "Prime members can start saving before the event begins"; "you can set a target price on any specific item and get notified when the price drops - or turn on Auto-Buy, and Alexa will automatically purchase it when it hits your price target." Amazon's event page: live "through 11:59 p.m. PDT on Wednesday, October 7". aboutamazon.com
- Target, press release, 15 September 2026: "Running Oct. 6-7, the event features up to 40% off thousands of items". corporate.target.com
- NBC Select, September 2026: "Walmart's Deal Days sale 2026 is happening Oct. 5 to 11, which overlaps with Amazon's annual October Prime Day, which will take place Oct. 6 and 7." nbcnews.com
- Supermarket News, reporting Numerator's first-day read, 7 October 2026: "Household spending at Amazon increased 48% compared with an average Tuesday - more than three times the lift Walmart recorded on the first day of its sale. Target saw no lift"; "27% shoppers used the sale to offset price increases related to rising prices compared to just 14% last year." supermarketnews.com
- Numerator, Prime Big Deal Days 2026 tracker, final update 8 October 2026 ("an early read and are subject to change"): "The majority of Prime Big Deal Days participants (55%) compared prices and products at other retailers before making their Amazon purchase"; "24% say they planned to or already had participated in Target Circle Deal Days and 33% said the same of Walmart Deals"; top sellers "Premier Protein 30g Protein Shakes, Lysol Disinfecting Wipes, Scott ComfortPlus Toilet Paper, Dawn Powerwash Spray, Dunkin' Refreshers Singles To Go"; "One in five participants (20%) said they used the sale to purchase holiday gifts"; "Among those who purchased holiday gifts, 18% said they completed more than half of their gift shopping during the sale." numerator.com
- Digital Commerce 360, reporting Adobe, 8 October 2026: "online shoppers spend $9.86 billion at U.S. retailers"; "sales grow by 8.5% year over year"; "Sales in the personal care products category were up 73% from September."; "Adobe sees this activity leading retailers to invest in earlier pre-holiday promotions than they would otherwise hold." digitalcommerce360.com
- Bell, Chiang and Padmanabhan, "The Decomposition of Promotional Response: An Empirical Generalization", Marketing Science, 1999: "On average, we find that 25% of the elasticity is due to primary demand expansion (i.e., purchase acceleration) and 75% to secondary demand effects or brand switching"; "we do not attempt to address store switching." ideas.repec.org; the quotes are from the authors' accepted manuscript, repository.upenn.edu
- Van Heerde, Leeflang and Wittink, "Decomposing the Sales Promotion Bump with Store Data", Marketing Science, 2004: "each of these three parts contribute about one third on average. One extension we propose is the separation of the category-expansion effect into cross-store and market-expansion effects."; for tuna, cross-store 25 percent and market expansion 6 percent of the bump; "These results are quite unreliable, because only four out of 16 cross-store effects are significant." ideas.repec.org; the tuna figures are in Table 4 of the full article, doi.org/10.1287/mksc.1040.0061
- Numerator, Prime Day 2026 tracker, final update 26 June 2026: "Nearly half of shoppers reported purchasing an item they had been waiting to buy until it went on sale." numerator.com
- Amazon, Holiday Beauty Event, 14 October 2026: "running October 19 through November 1"; "October 31-November 1: Up to 40% off Personal Care". aboutamazon.com
Keep going
Pair this with the playbook and the lessons that teach the methods behind it.
Playbook
End or shrink a promotion. How to decide whether an event earns its place in the plan, once the share of its volume that was new is known.
More from the blog
Why CPG promotions destroy value, and the three metrics that prove it. Three measures of what a consumer packaged goods (CPG) promotion returns, and how to read an event against them.
Why BOGO is dying, and what works instead. How buy-one-get-one-free (BOGO) deals pull volume forward into shoppers' cupboards.
The case for ending half your promotional plan. What happens to volume and profit when weak events come out of the calendar.
Lessons inside the course
Source of volume →The net incremental volume formula, store switching and the cross-retailer check, the two shares, and break-even incrementality, all used in this article.Start the lesson → Promo ROI fundamentals →Return on investment (ROI) for a promotion: how to value new units at full-price gross profit, subtract the funding once, and read the return.Start the lesson → Baseline vs. incremental →How to set the normal week an event is measured against, and why back-to-back events make it harder.Start the lesson →Try it free
Source-of-Volume Decomposer. This link opens it on the 3,400 units left in this article's example once cannibalization and store switching are taken out, with both dips in the pantry-loading slider: it shows the same 1,360 new units. Its 40 percent net share is a share of those 3,400 units, not of the 7,300 uplift, and its money figures use the tool's own biscuit example. Free and without sign-up.