Why Price Elasticities From the Cost-of-Living Squeeze Need Retesting
Estimates fitted when nearly every brand raised prices together can understate one brand's loss.
The short version
- Real pay growth has stalled in 2026. Real hourly earnings fell 0.7 percent in America in the year to September 2026. On the Academy's calculation from Eurostat data, euro area real wages were flat in the second quarter of 2026.1
- Elasticities fitted on 2022 to 2024 sales can understate what a brand loses when it raises its price alone. They learned mostly from 2022 and 2023, when nearly every brand raised prices together, so they can behave like a category elasticity, which usually shows a weaker response than a brand's.2
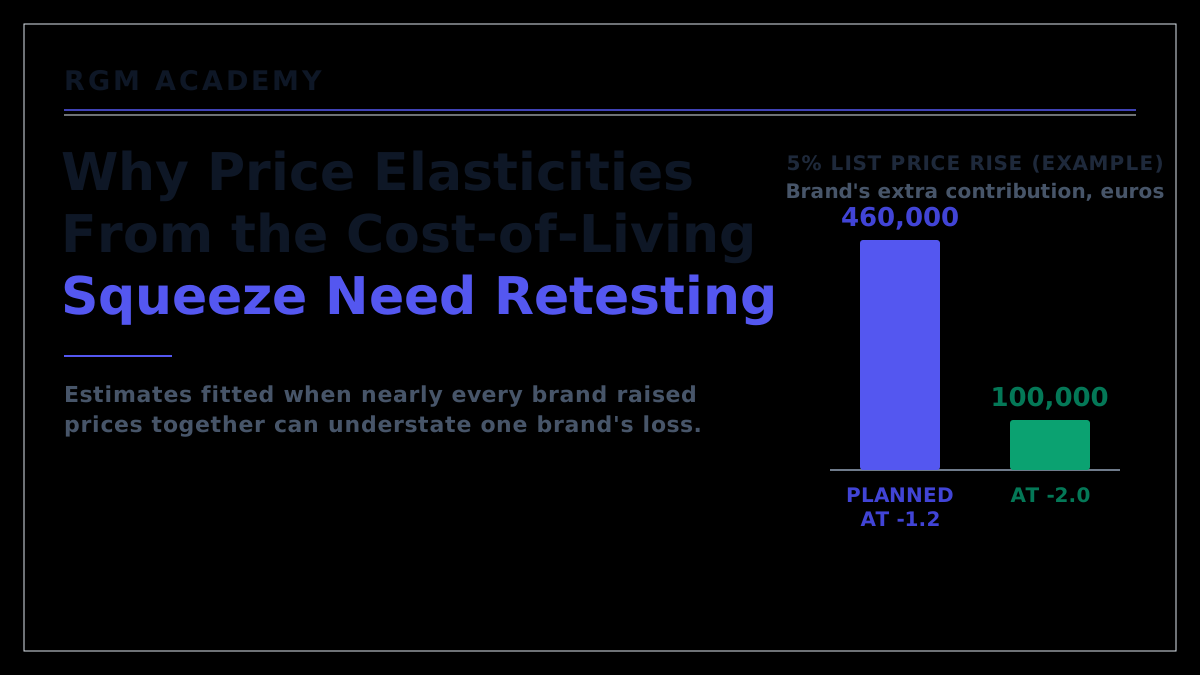
- A wrong elasticity can turn a profitable price rise into a loss. In the worked example, a 5 percent list price rise planned on an elasticity of -1.2 promises the brand 460,000 euros a year of extra contribution. At -2.0 it delivers 100,000 euros, and at -2.6 it loses 170,000 euros. On the Academy's break-even test, the rise breaks even at -2.22.
- The old estimate can be tested before the 2027 price negotiations begin. Running it on the sales of 2025 and 2026, which were not used to fit it, shows whether it still holds.
What has happened to real pay?
In the year to June 2022 real average hourly earnings in America fell 3.6 percent, and British real regular pay fell 3.0 percent in April to June 2022, a record fall at the time. Pay then grew faster than prices again, as the euro area chart below shows.1
In the year to September 2026, by contrast, real average hourly earnings in America fell 0.7 percent, and British real regular pay grew 0.6 percent in the three months to July 2026. In the euro area hourly wages rose 3.0 percent in the second quarter of 2026, the same as consumer prices. Energy prices are rising fastest. In the year to September 2026 they rose 20.4 percent in America and, on Eurostat's first estimate, 18.8 percent in the euro area. Food inflation is low, at 1.8 percent for American groceries in September 2026 and 0.7 percent in the euro area in August 2026.1
Low food inflation in 2026 has not undone the squeeze. Euro area food prices rose 33.1 percent between the first quarter of 2021 and the second quarter of 2026, and hourly wages 21.4 percent. An hour's pay therefore buys about 9 percent less food than before the squeeze (1.214 divided by 1.331 is about 0.91).
Real pay growth has stalled in 2026, and an hour's pay still buys less food than it did before the squeeze.
Why were elasticities from the squeeze years so low?
Price elasticity is the percentage change in volume divided by the percentage change in price, so at -1.2 a 5 percent price rise cuts volume by about 6 percent (5 times 1.2). An estimate fitted on sales from 2022 to 2024 learned most of what it knows about price from 2022 and 2023, when prices moved most. In those two years nearly every brand raised its prices at the same time, shoppers expected rises, and until mid-2023 real pay was falling.
Companies said at the time that volumes were falling less than usual. In March 2023 General Mills reported that "volume elasticities remained below historical levels". In January 2024 Mondelez's chief executive put elasticity "at or below historical norms", and its finance chief gave one reason for confidence: "competitors ... will have to price too".2
In those years a brand's own price and its category's price moved together, so a model found it hard to tell them apart. The number it produced is called a brand elasticity, but much of what it measured was the category's response, unless the model also included competitors' prices and those prices moved at different times from the brand's. No published study has directly measured that gap between what the number was called and what it measured; the company remarks above point to it. Falling real pay in the same months blurs the estimate further. The model has to separate the effect of falling pay from the effect of higher prices, and an error in that split could push the estimate either way.
Brand and category elasticity
Brand elasticity is the percentage change in a brand's volume divided by the percentage change in its price, with competitors' prices unchanged. Shoppers can switch to another brand, so the response is usually larger. Category elasticity is the same ratio for the whole category when all prices move together. Shoppers can only buy less or leave the category, so the response is usually smaller. The Academy's elasticity lesson says to use the category figure when every brand raises prices at once, because switching between brands largely cancels out. As a rule of thumb, not a measured result, it puts brand elasticity at roughly 2 to 3 times the category figure.
Company results since then point to stronger reactions. PepsiCo raised prices by double-digit percentages for eight straight quarters in 2022 and 2023, and sales of its drinks and Frito-Lay snacks then fell. Early in 2026 it cut the suggested retail prices of its main chip brands in America by up to nearly 15 percent; the shelf prices were the retailers' decision.3 On 30 September 2026 Conagra's finance chief said the company was "factoring in greater-than-historical volume elasticities" in parts of its business.2
An elasticity fitted on the squeeze years can understate what a brand loses when it raises its price alone, and PepsiCo's and Conagra's experience since then points the same way.
Does price sensitivity rise when times are hard?
Past downturns suggest that it does on average, with large differences between categories. A study of 19 American grocery categories from 2001 to 2006 found that price sensitivity rose in weak economic times in seven categories, fell somewhat in six and did not change in six. Categories that take a large share of the household budget tended to become more sensitive.4
Shoppers who traded down during the squeeze have not all traded back, so private label is now a familiar alternative when a brand raises its price alone. Part of the share that private label gains in a downturn is permanent, a study of four countries found.5 In a 2026 survey by Simon-Kucher, a consultancy, only a quarter of 14,000 shoppers in 14 countries said they would return to brands if prices fell.6 In Britain, sales of branded groceries grew faster than private label's in the four weeks to 6 September 2026, 3.7 percent against 2.9 percent. That reverses the pattern of much of 2026, but is one month of data.7
The large everyday categories are the likeliest to have become more price sensitive since the last estimate, because food takes more of an hour's pay than in 2021 and energy is squeezing the rest of the budget.
What does a wrong elasticity cost?
Take an invented snack brand that sells 1,000,000 cases a year at a net price of 20.00 euros a case after its trade terms with retailers. Each case costs 12.00 euros to make and deliver, so the brand keeps 8.00 euros a case (20.00 less 12.00). That is its contribution, the money left to cover fixed costs and profit: 8 million euros a year (1,000,000 cases at 8.00 euros). It plans a 5 percent list price rise. If its trade terms stay the same share of list price, its net price also rises 5 percent, to 21.00 euros a case (20.00 plus 5 percent). Its contribution rises to 9.00 euros a case (21.00 less 12.00). Its finance team's elasticity, fitted on 2022 to 2024 sales, is -1.2.
Elasticities are usually measured against the shelf price that shoppers pay, and each retailer decides its own shelf price; a recommended retail price from the brand is only a direction. The example assumes full pass-through, with each retailer raising its shelf price by 5 percent. A retailer that keeps the same percentage margin raises its shelf price by that same 5 percent. One that keeps the same margin per case in euros raises its shelf price by less than 5 percent, because its own margin is part of the shelf price and does not rise. Volume then falls by less than the figures below show.
At -1.2, volume falls 6 percent (1.2 times 5 percent) to 940,000 cases. At 9.00 euros of contribution a case, that is 8.46 million euros, so the brand's contribution rises by 460,000 euros a year (8.46 million less 8 million). If the brand's elasticity has moved to -2.0, volume falls 10 percent to 900,000 cases, which give 8.10 million euros, and the gain shrinks to 100,000 euros. At -2.6, volume falls 13 percent to 870,000 cases, which give 7.83 million euros, and the rise loses 170,000 euros. That elasticity is a stress case, close to the average of -2.62 across 81 published studies.8
Break‑even sales change and break‑even elasticity
The Academy's break-even lesson measures how much volume a price rise can lose before contribution falls: Break-Even Sales Change (BESC) = -price change / (contribution margin + price change). Here the margin is 40 percent (8.00 divided by 20.00), so BESC = -5 / (40 + 5) = -11.1 percent. Dividing that 11.1 percent fall by the 5 percent rise gives the break-even elasticity, -2.22. When the break-even sits inside the range of elasticities a team cannot rule out, as -2.22 does here between -2.0 and -2.6, the rise needs testing before it goes ahead across the whole business.
The break-even lesson also calls a move a coin flip when the forecast loss lands within 1.5 points of the BESC, because forecasts carry error. At -2.0 the forecast loss of 10 percent sits 1.1 points inside the 11.1 (11.1 less 10), so even the case that still earns 100,000 euros falls in that zone.
Shoppers usually respond less to a price cut than to an equal rise. In the Academy's elasticity lesson a 5 percent rise costs about 9 percent of volume and an equal cut gains about 6 percent, a ratio of 1.5. An elasticity estimated on rises therefore overstates what a later cut wins back.
Suppose the rise loses 100,000 cases at -2.0, 10 percent of the brand's volume, and the brand then takes its net price back to 20.00 euros a case, with each retailer assumed to take its shelf price back too. If shoppers responded to the cut as strongly as to the rise, it would win back all 100,000 cases. At the lesson's ratio the cut wins back two-thirds of them (1 divided by 1.5), about 66,700. The brand ends at about 966,700 cases (900,000 plus 66,700), 3.3 percent below where it started at the same price. Its contribution ends about 266,700 euros a year lower: the 33,333 cases it did not win back (a third of the 100,000 lost), at 8.00 euros a case.
A price rise planned on too low an elasticity can lose money, and cutting the price back later does not win back all the volume it lost.
How can a team tell whether its elasticity still holds?
The Academy's elasticity lesson names the use of stale estimates as a pitfall and advises re-estimating at least once a year. The first test is to fit the model on data to the end of 2024, give it the prices and promotions that actually ran from January 2025 to June 2026, and compare the sales it predicts with what the brand sold. Errors that lean the same way period after period mean the model has gone stale. If the misses are largest when the brand's own price moved, the elasticity is the likely cause.
The tracking signal
The Academy's lesson on baselines measures that lean with the tracking signal: the running sum of forecast errors divided by the mean absolute deviation, the average size of the errors ignoring sign. Random errors cancel out and keep it near zero; errors that lean one way push it steadily up or down. The lesson treats a value beyond 4 in either direction as a sign that the forecast needs recalibrating.
A second test is to re-estimate the elasticity on the latest two years of data, then move that two-year window forward a quarter at a time, to see whether the estimate has left its old range or is only varying within it. A structural-break test, a statistical check for the point at which a relationship changed, then shows when the change happened.
A model that includes real pay or energy prices as separate variables, and measures the brand's price against both its competitors' prices and the category's price level, is less likely to need rebuilding each time the economy turns. National pay data move slowly, though, and give it little to learn from. Whichever model the team uses, each price move can be shown to the board at three elasticities (the old estimate, the new one and a stress case near the published average), and the moves that make money at all three can go ahead first.
A project that estimated more than 7.5 million elasticities from retail scanner data found that their distribution did not shift ("stationary over time") in the years it covers.9 In a 2024 study of a 35-week price experiment across 82 test stores, the average elasticity was -0.34 in the experiment against -1.97 from standard estimates on observational data, the sales recorded in normal trading. A standard estimate can therefore overstate price sensitivity too.10 In a category that takes a small share of the household budget, where competitors and private label move with the brand, a squeeze-era estimate may still be close enough. But an estimate that has not been tested against the conditions of 2026 should not be assumed to hold.
An elasticity fitted on the squeeze years should be tested against sales from 2025 and 2026 before it is used to set list prices for 2027.
References
- Official statistics. US Bureau of Labor Statistics, Real Earnings, 14 October 2026: "From September 2025 to September 2026, real average hourly earnings decreased 0.7 percent, seasonally adjusted"; Real Earnings, 13 July 2022: "Real average hourly earnings decreased 3.6 percent, seasonally adjusted, from June 2021 to June 2022"; Consumer Price Index, September 2026: "The food at home index rose 1.8 percent over the 12 months ending in September"; "The energy index increased 20.4 percent for the 12 months ending September". Office for National Statistics, Average weekly earnings, September 2026: real growth on CPIH (the Consumer Prices Index including owner occupiers' housing costs) "was 0.6% for regular pay"; August 2022: regular pay fell 3.0 percent in real terms in April to June 2022, "a record fall for regular pay". Eurostat, flash estimate, 2 October 2026: energy expected at 18.8 percent in September 2026; food and non-alcoholic beverages 0.7 percent in August 2026 (harmonized index of consumer prices, HICP, dataset prc_hicp_minr); hourly wages and salaries up 3.0 percent in the second quarter of 2026 (labor cost index, dataset lc_lci_r2_q). Euro area real wages are the Academy's calculation from the two Eurostat series. bls.gov; bls.gov (2022); bls.gov (CPI, September 2026); ons.gov.uk; ons.gov.uk (2022); europa.eu
- Company remarks. General Mills, prepared remarks, 23 March 2023: "Volume elasticities remained below historical levels through the first three quarters of fiscal 2023". Mondelez, earnings call, 30 January 2024, chief executive Dirk Van de Put: "elasticity is still at or below historical norms"; finance chief Luca Zaramella: "competitors, as I said, will have to price too". Conagra, first-quarter results, 30 September 2026, its finance chief as reported by Reuters, republished by The Poultry Site: "factoring in greater-than-historical volume elasticities". General Mills investor site (q4cdn.com); marketbeat.com; thepoultrysite.com
- Food Manufacturing, "PepsiCo is raising prices on Doritos and more after a weak quarter in North America", 9 October 2026: "The company hiked prices by double-digit percentages for eight straight quarters in 2022 and 2023"; "Consumers revolted, and sales of PepsiCo's drinks and Frito-Lay snacks fell"; it "slashed prices on Lay's, Doritos, Cheetos and Tostitos chips by up to 15%"; the new rises "will be in the single-digit percentage range, and prices will still be lower than they were at the start of this year". PepsiCo, "PepsiCo makes iconic snacks more affordable ahead of Super Bowl", 3 February 2026: "Up to nearly 15% off your favorite snacks like Lay's, Doritos, Cheetos, and Tostitos and more."; "The new suggested retail prices begin rolling out in the United States this week."; "Retailers determine their own retail prices, so what you see in-store may vary." foodmanufacturing.com; pepsico.com
- Gordon, Goldfarb and Li, "Does Price Elasticity Vary with Economic Growth? A Cross-Category Analysis", Journal of Marketing Research, February 2013: price sensitivity is countercyclical "in seven categories, but it is somewhat procyclical in six categories and noncyclical in the remaining six"; "high share-of-wallet categories display higher price sensitivity when the economy is weaker"; "We show that the blanket claims that price sensitivity rises in difficult economic times are incorrect". northwestern.edu
- Lamey, Deleersnyder, Dekimpe and Steenkamp, "How Business Cycles Contribute to Private-Label Success", Journal of Marketing, 2007 (working-paper version, 2005): "part of private-labels' share gain during contractions is found to be permanent". repub.eur.nl
- Simon-Kucher, Global Shopper Study 2026, 14,000 consumers in 14 countries: "If prices fall, only a quarter of consumers say they would return to brands." simon-kucher.com
- Worldpanel by Numerator, as reported by Fruitnet, 15 September 2026, four weeks to 6 September 2026: "branded goods outpaced own-label with sales up 3.7 per cent compared to 2.9 per cent growth for own-label"; "This is a reversal of a pattern that has defined much of 2026". fruitnet.com
- Bijmolt, van Heerde and Pieters, "New Empirical Generalizations on the Determinants of Price Elasticity", Journal of Marketing Research, 2005: "Across a set of 1851 price elasticities based on 81 studies, the average price elasticity is -2.62." sagepub.com
- Seven Million Demand Elasticities, a project of researchers at Arizona State University, the Federal Reserve Bank of San Francisco and the University of Chicago: "we estimate over 7.5 million demand elasticities"; "We find that the distribution of these elasticities is stationary over time." berkeley.edu
- Bray, Stamatopoulos and Sanders, "Prices Are Endogenous: Evidence from a Large-Scale Pricing Experiment", Kellogg School of Management, 2024: a 35-week experiment in 82 "test" stores and 34 "control" stores; "the average experimental elasticity is -0.34"; "the average observational elasticity is -1.97". northwestern.edu
Keep going
Pair this with the playbook and the lessons that teach the methods behind it.
Playbook
Price rise or pack shrink. Five questions to answer before raising a price or shrinking a pack, with the case of Carrefour and PepsiCo in 2023 and 2024.
More from the blog
The consumer came back. They came back different. Why one category elasticity can blend two groups of shoppers who respond in very different ways.
Why 1% more in price beats 5% in volume. Why a 1 percent gain in price moves operating profit far more than a 1 percent gain in volume.
The great RGM reset: from price‑led to volume‑led in 2026. Why growth led by price has run its course for many brands.
Lessons inside the course
Price elasticity →Brand against category elasticity, why an estimate from earlier years may not hold today, and how rises and cuts can draw different responses.Start the lesson → Price thresholds →Price cliffs and reference prices: why crossing a price point can cost more volume than a smooth elasticity predicts.Start the lesson → Baseline and incremental →The tracking signal, and how to tell when a forecast has started leaning one way.Start the lesson → Break-even sales analysis →How much volume a price rise can afford to lose before it stops paying, and the break-even elasticity of -2.22 that this article's example also reaches.Start the lesson →Try it free
Break-Even Calculator. Opens on this article's rise, 5 percent at a 40 percent contribution margin with an elasticity of -1.2: the rise can lose 11.1 percent of volume and is expected to lose 6. Move the elasticity to -2.0 and then -2.6 to watch the safety margin shrink and then turn negative. Free and without sign-up.
Price Elasticity Calculator. Move the price and watch volume and gross profit respond under the elasticity you assume. Free and without sign-up.