Why a Price Cut Is Hard to Take Back: The Case of PepsiCo's Chips
Two numbers show when a cut lowers profit; months later, shoppers expect the lower price.
The short version
- On 3 February 2026 PepsiCo cut the suggested prices of Lay's, Doritos, Cheetos and Tostitos by up to nearly 15 percent. By the third quarter of 2026 its North American foods business sold about the same volume as a year earlier and earned 12 percent less core operating profit, a fall PepsiCo attributes partly to what it calls affordability investments.123
- The Academy's two-number test, the contribution margin times the price sensitivity, shows which side of the profit hill a price sits on. Below 1, a cut lowers profit, even when it raises volume and revenue.
- Once shoppers expect the lower price, a rise from it costs more volume than the cut won until they catch up. The share a return would hand back to rivals limits how far back the price can go.
- Before a cut taken for volume, a manufacturer should run the two-number test, put a figure on what the cut costs and plan the way back.
What did PepsiCo's price cut buy?
On 3 February 2026 PepsiCo cut the suggested retail prices of Lay's, Doritos, Cheetos, Tostitos and other chips in the United States by "up to nearly 15%". An 8-ounce bag of Lay's classic went from 4.99 to 4.29 dollars, 14.0 percent less (0.70 divided by 4.99). Retailers, PepsiCo added, "determine their own retail prices".14
At PepsiCo Foods North America, which sells the chips and Quaker foods, unit volume rose 2 percent in the first quarter of 2026 and was flat in the second and third. Core operating profit fell 4, 8 and 12 percent in those three quarters, each against the same quarter a year earlier.2 PepsiCo gives several reasons for the fall in its operating margin in the third quarter of 2026: "affordability investments", the comparison with a one-off asset-sale gain a year earlier, and more advertising and marketing.3 Most of the profit fall sits below gross profit, the line closest to the two-number test: core gross profit fell 41 million dollars, or 1 percent, and core operating profit 188 million.2 The figures do not show how much of either fall the cut caused.
On 24 September 2026 a PepsiCo spokesperson told Reuters that some chip prices would rise "in the low- to mid-single-digit percentage range" and stay "lower than they were before the price cuts".5 On the results call on 8 October 2026 the chief executive spoke of "less volume growth than what we had initially anticipated", which he put down to "the consumer environment", according to a transcript.6 Two Academy methods, the profit hill and asymmetric elasticity, help explain why so deep a cut is hard to take back by more than a few percent.
After the cut, volume rose for one quarter and then held flat while operating profit fell each quarter, and PepsiCo is now taking back only a small part of the cut.
Which side of the profit hill was the price on?
The Academy's lesson on parabola analysis draws profit against price as a hill: at a very low price each bag earns little, at a very high price few bags sell, and profit peaks in between. Two numbers show which side of the top a price stands on. The contribution margin is the share of the net price left after the variable cost, the costs that rise with each bag sold. The price sensitivity is the percentage change in bags sold for a 1 percent change in price (an elasticity, without its minus sign). Multiply them: below 1, the price sits below the top, and a cut moves it further away.
The two-number test
A 1 percent price cut gives up 1 percent of revenue on every bag that would have sold anyway. It wins extra bags equal to the sensitivity, as a percentage of today's volume, and each extra bag earns only the margin, not the whole price. So a cut adds profit only if margin times sensitivity is above 1. The lesson's Lerner condition says the same: at the top of the hill the margin, (P - C) / P for price P and variable cost C, equals 1 / e, one divided by the sensitivity. A margin below that is, in the lesson's words, "underpricing (leaving profit on the table)". Because the test uses today's sensitivity, it is reliable on direction and only a guide to how far away the top is.
PepsiCo's North American foods business earned a core gross margin of 60.4 percent in the third quarter of 2026 (3,928 million dollars of core gross profit on 6,504 million of net revenue).2 At that margin a cut adds profit only if the sensitivity is above 1.66 (1 divided by 0.604), and the true hurdle is higher, because gross margin overstates the contribution margin. Shoppers respond to the shelf price, so their sensitivity carries over one for one to PepsiCo's price only if retailers pass changes on in the same percentage. A cut passed on in cents, a smaller percentage of the higher shelf price, lowers the test further.
One large study of US household purchases from 2001 to 2006 measured potato chip brands at 1.08 and tortilla chip brands at 1.12. The test reads about 0.65 (0.604 times 1.08).7 The Academy's elasticity lesson puts category leaders at 1.0 to 1.5, a test of 0.60 to 0.91. In the study, all but 0.08 of the 1.08 was shoppers switching brands rather than buying more chips. A manufacturer cutting most of its brands at once gains nothing when shoppers switch among them, so the study's split suggests its sensitivity across the range sits below a single brand's. The data are 20 years old, and the study found that sensitivity rises when the economy weakens, but it would need to be about 50 percent higher, above 1.66, before a cut added profit.
On the published margin and the measured sensitivity of chip brands, the test reads below 1, so a cut taken for volume would be expected to lower profit even as volume rose.
What does a cut below the top do to profit?
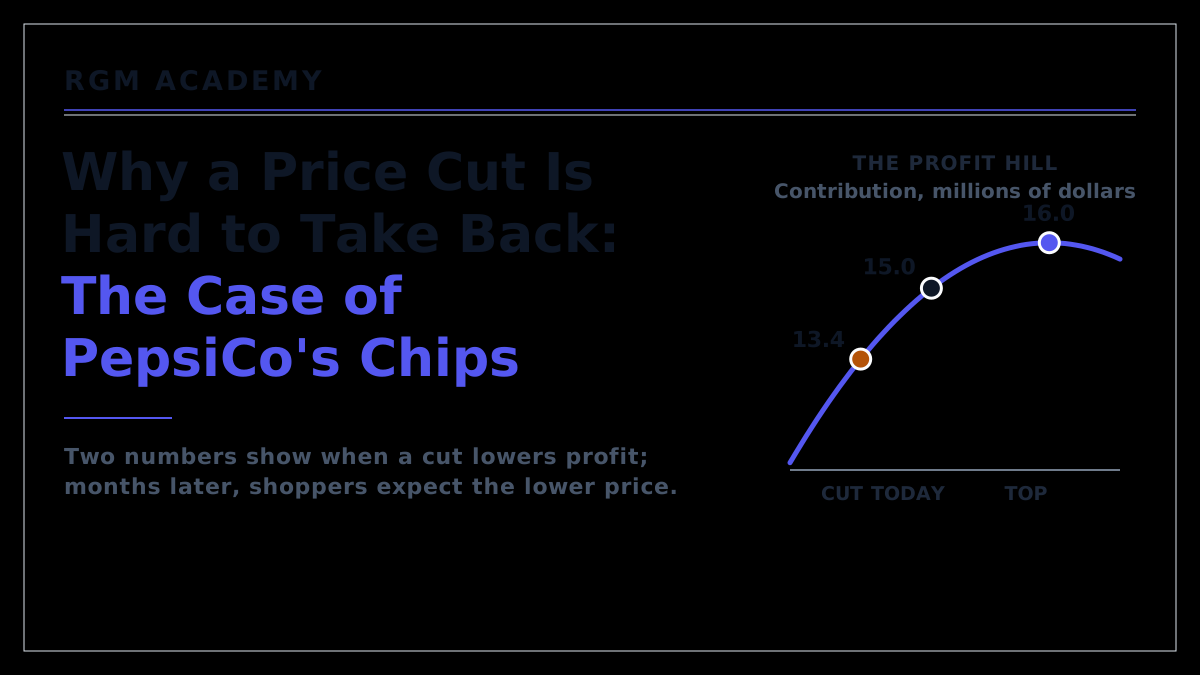
Take an invented manufacturer that sells 10 million bags of chips a year at a net price of 3.00 dollars, the money it keeps from each bag after trade terms. Its variable costs, cost of goods sold (COGS) and delivery, are 1.50 dollars a bag, so each bag contributes 1.50 dollars, a 50 percent margin. The year's contribution is 15 million dollars. Its price sensitivity is 1.2. The shelf price is the retailer's; the example assumes each retailer moves it by the same percentage as the manufacturer's price. The test gives 0.60 (0.50 times 1.2), so 3.00 dollars sits below the top of the hill. The concept box puts it at 3.50 dollars and 16 million dollars of contribution.
Where the top of the hill sits
On a straight demand line the lesson puts the top at P* = a / (2b) + C / 2, where a is the bags that would sell at a price of zero, b the bags lost for each dollar of price and C the variable cost per bag. Here b is 4 million (1.2 times 10 million, divided by 3.00) and a is 22 million (10 million plus 4 million times 3.00). The first term, 2.75 dollars (22 million divided by twice 4 million), is the price that earns the most revenue; adding half the variable cost, 0.75, puts the profit top at 3.50. There 8 million bags sell (22 million less 4 million times 3.50) and earn 2.00 dollars each, 16 million in all. A cost change moves the top by half as much.
Now cut the price by 10 percent, to 2.70 dollars. Sales rise 12 percent, to 11.2 million bags (22 million less 4 million times 2.70). Revenue rises 0.8 percent, to 30.24 million dollars (2.70 times 11.2 million). Contribution falls 10.4 percent, or 1.56 million dollars, to 13.44 million (1.20 a bag, 2.70 less 1.50, times 11.2 million). The Academy's break-even sales change shows the same from the other side: it divides the cut by the margin left after it, so a 10 percent cut at a 50 percent margin needs 25 percent more bags to keep contribution level (10 divided by 40). This one wins 12.
A cut taken below the top of the profit hill lowers profit even when it raises volume and revenue, and the two-number test shows in advance which kind of cut it is.
Why is the climb back steeper than the way down?
Costs then rose: PepsiCo said its price rises were needed to recoup rising costs, according to the Associated Press.8 In the example, 10 cents more cost, to 1.60 dollars, lifts the top by half as much, to 3.55 dollars, and leaves the cut price further below it. That is the case for raising the price part of the way back.
A price paid for months, however, becomes the reference price shoppers judge against, and they react more to a price above their reference than to one below it.9 The Academy's lesson on price thresholds models the reference price as moving a share of the way, 0.2 to 0.5, toward the price paid at each purchase. At 0.2, the slowest rate, a shopper who buys chips every week had closed 99.9 percent of the gap in the 33 weeks between the cut and the Reuters report. One buying every three weeks had closed about 91 percent. A rise is then felt as a loss. The elasticity lesson calls this asymmetric elasticity and puts a number on it: a rise meets the base sensitivity times an asymmetry factor of 1.2 to 1.5, and a cut meets the base divided by that factor. So a rise loses about 1.5 to 2 times what an equal cut wins.
Return to the example, with costs at 1.60 dollars and shoppers judging against 2.70. Staying at 2.70 earns 12.32 million dollars (1.10 a bag, 2.70 less 1.60, times 11.2 million). With a factor of 1.5, each 10 cents above 2.70 loses 600,000 bags instead of the 400,000 the straight line predicts. Going back to 3.00 dollars sells 9.4 million bags (11.2 million less 6 million times 0.30). It earns 13.16 million dollars (1.40 a bag, 3.00 less 1.60, times 9.4 million), more than staying. Without the cut, 3.00 dollars would now earn 14 million (1.40 times 10 million), so the return falls 840,000 dollars a year short while shoppers judge against 2.70. The example applies the factor to the rise only, which flatters the cut: at the lesson's sensitivity for cuts, 1.2 divided by 1.5, the cut would have won 800,000 bags, not 1.2 million.
They do not judge against it for long: on the same model, for a shopper who buys every week, about 90 percent of the gap to the new price closes in 10 weeks. The shortfall starts at about 16,000 dollars a week (840,000 divided by 52) and shrinks by a fifth each week. In all it comes to five full weeks (1 divided by 0.2), about 81,000 dollars, or about 242,000 if shoppers buy every three weeks. The asymmetry makes the way back cost more but, at this factor, does not stop it: a full return would only match staying at 2.70 if a rise lost twice the bags the straight line predicts, beyond the lesson's typical range.
The cost that lasts longest is the share handed back to rivals. A study of a Dutch supermarket price war, which retailers started, found that brands gained sales and share only while they kept their lower price after rivals' prices went back up, and that "restoring prices without additional price promotion support can severely damage brands' performance".10 Utz, a branded rival, did not follow the cut: in the second quarter of 2026 its net price rose 3.6 percent and its volume and mix fell 2.2 percent. Leaving out a bonus-pack promotion it was lapping from a year earlier, the figures are 3.0 and 1.6 percent.11
A rise from a price shoppers have come to expect costs more volume than the cut won until they catch up: the asymmetry sets what the way back costs, and the share handed back to rivals sets how far back the price can go.
What should a manufacturer settle before it cuts?
PepsiCo's chief executive said on the call that the "pricing investment" had worked, according to the transcript, and the company's remarks on the third quarter of 2026 report better household penetration and purchase frequency.36 The parabola lesson allows for a price below the top: "Sitting below it on purpose, with a number attached to what that costs, is a strategy." In the example, the number is 1.56 million dollars a year at the old cost. An investment case for the cut has to show that the households it wins are worth more than that over the years they keep buying, and the price-war evidence says the gain lasts only while the lower price holds.
Three things are worth settling before a cut taken for volume. The first is the two-number test, on the net price the manufacturer keeps. The second is the cost of the cut on that net price, stated in money and agreed as an investment with a date for review. The third is the way back, using the manufacturer's own asymmetry factor, measured from its past rises and cuts. The headline can mislead: PepsiCo's suggested prices fell by up to nearly 15 percent, while effective net pricing across its North American foods business, which counts price, promotions and mix together, fell 1 to 2 points a quarter. The list price is the manufacturer's to set, and the shelf price stays the retailer's decision, as PepsiCo's chief executive said on the call, according to the transcript: "We don't set pricing. Obviously, our customers do."6
A price cut taken for volume is a commitment, so before it cuts, a manufacturer should know which side of the profit hill it is on, what the cut costs and how far back it can climb.
References
- PepsiCo, "PepsiCo makes iconic snacks more affordable ahead of Super Bowl", 3 February 2026: "Up to nearly 15% off your favorite snacks like Lay's, Doritos, Cheetos, and Tostitos and more."; "The new suggested retail prices begin rolling out in the United States this week."; "Retailers determine their own retail prices, so what you see in-store may vary." pepsico.com
- PepsiCo earnings releases, third quarter of 2025 to third quarter of 2026, PepsiCo Foods North America: unit volume -4, -1, +2, 0 and 0 percent; effective net pricing +2, +1, -1, -2 and -1 points; core operating profit -3.5, -2, -4, -8 and -12 percent. Third quarter of 2026: net revenue 6,504 million dollars, core gross profit 3,928 million against 3,969 million, core operating profit 1,382 million against 1,570 million. Effective net pricing "reflects the year-over-year impact of discrete pricing actions, sales incentive activities and mix". The fourth quarter of 2025 has 16 weeks, the others 12. Q3 2026; Q2 2026; Q1 2026; Q4 2025; Q3 2025
- PepsiCo, prepared management remarks, third quarter of 2026: "PepsiCo Foods North America's core operating margin declined 280 basis points reflecting the impact of affordability investments, the lap of an asset sale gain in the prior year quarter and higher advertising and marketing investments"; "year-to-date household penetration, purchase frequency and velocity trends have improved". investors.pepsico.com
- NACS Daily, citing the Wall Street Journal, 4 February 2026: "an 8-ounce bag of Lay's classic potato chips could fall to $4.29 from $4.99." convenience.org
- Reuters, 24 September 2026, citing Bloomberg: "The fresh round of price hikes will be implemented for some chip brands in the low- to mid-single-digit percentage range"; "The new prices will be lower than they were before the price cuts earlier this year, and the company is trying to maintain lower prices where it can". reuters.com
- PepsiCo third quarter 2026 earnings call, 8 October 2026, transcript published by The Motley Fool, which warns that transcripts may contain errors: "less volume growth than what we had initially anticipated. It had to do with the consumer environment."; "we're pleased with how the pricing investment has worked for us in the food business."; "We don't set pricing. Obviously, our customers do." webull.com
- Brett R. Gordon, Avi Goldfarb and Yang Li, "Does Price Elasticity Vary with Economic Growth? A Cross-Category Analysis", Journal of Marketing Research, 2013. US household data, 19 categories, 2001 to 2006: brand price elasticity 1.08 for potato chips and 1.12 for tortilla chips, of which 0.08 and 0.17 came from the category as a whole; "secondary demand effects are larger than primary demand effects in all the categories." kellogg.northwestern.edu
- Associated Press via Food Manufacturing, 9 October 2026: "The price hikes, which will hit Doritos, Ruffles, SunChips and some sodas, will be in the single-digit percentage range, and prices will still be lower than they were at the start of this year. PepsiCo said Thursday that it must raise prices to recoup rising costs for fuel, aluminum and agricultural commodities." foodmanufacturing.com
- Gurumurthy Kalyanaram and Russell S. Winer, "Empirical Generalizations from Reference Price Research", Marketing Science, 1995: "consumers rely on past prices as part of the reference price formation process"; "consumers have been found to be more sensitive to 'losses,' i.e. observed prices higher than reference prices, than 'gains.'" ideas.repec.org
- Francesca Sotgiu and Katrijn Gielens, "Suppliers Caught in Supermarket Price Wars", Journal of Marketing Research, 2015: "Only after the PW, when rivals' prices are restored and the focal brand's reduced retail price is maintained, can substantial sales, revenues, and share gains be realized. Moreover, restoring prices without additional price promotion support can severely damage brands' performance." journals.sagepub.com
- Utz Brands, second quarter 2026 results, 5 August 2026: "favorable net price realization of 3.6% partially offset by lower volume/mix of (2.2)%"; "Excluding the Bonus Packs promotion, net price realization increased 3.0% and volume/mix decreased 1.6%."; "The Company's Retail Volumes decreased by 4.6%, impacted by the lap of Bonus Packs, compared to a 1.1% increase for the Salty Snack category." q4cdn.com
Keep going
Pair this with the playbook and the lessons that teach the methods behind it.
Playbook
Match a competitor's price, or hold? The same decision from the rival's side: whether to follow a price cut, and what following costs.
More from the blog
When matching a competitor's price cut destroys value. What a rival should do when a market leader cuts, and when matching saves its share.
Why 1 percent more in price beats 5 percent in volume. Why 1 percent of price is worth so much profit, the same leverage that makes a cut expensive.
The great RGM reset. The industry's move from price-led to volume-led growth, of which PepsiCo's cut is one example.
Lessons inside the course
Parabola analysis →The profit hill, where its top sits, the Lerner condition behind this article's two-number test, revenue against profit, and why on a straight demand line costs move the top by half.Start the lesson → Price elasticity →The lesson's section on asymmetric elasticity: why a rise costs more volume than an equal cut wins, and how to plan for the asymmetry factor.Start the lesson → Break-even sales analysis →The volume a cut must win to keep profit level, the 25 percent this article's 10 percent cut needed.Start the lesson → Price thresholds →How shoppers' reference prices follow the prices they pay, and how quickly a new price becomes the normal one.Start the lesson →Try it free
Price Elasticity Calculator. This link opens it with the optimal price marked, on the tool's own example product, a biscuit with a 4.29-dollar list price and a 2.49 cost: at a sensitivity of 1.7 the top of the hill sits above 4.29. Move the sensitivity to 3.0 and the top drops below it. Free and without sign-up.
Break-Even Calculator. This link opens it on the article's cut: 10 percent off at a 50 percent margin needs 25 percent more volume, and a sensitivity of 1.2 delivers 12. Free and without sign-up.