Why a Discounter Can Be a More Profitable Customer Than It Looks
A discounter can pay less per pack and cost less to serve; two numbers decide.
The short version
- In the 12 weeks to 4 October 2026 Lidl's sales in Britain rose 7.1 percent and Aldi's 0.4 percent, against 1.0 percent at Tesco.1 Both build their offer on low prices.
- Ranked by net price, a discounter that pays less per pack looks like a manufacturer's worst account. The Academy's customer profitability matrix adds the second number, the cost to serve, and on that measure the cheaper account can earn the manufacturer more.
- At equal revenue, the discounter earns more only if it saves more on the cost to serve, as a share of sales, than it gives up in gross margin. In a worked example it passes by 70,000 pounds, and fails by 27,500 once a dedicated pack and a one-penny price concession to the supermarket are added.
- The matrix says whether an account pays today; the Academy's customer investment map adds where it is heading, and on one 12-week reading of sales growth, a Lidl-like and an Aldi-like discounter would land in different tiers.
Which retailers are growing in 2026?
In the 12 weeks to 4 October 2026, Lidl's sales in Britain grew 7.1 percent. Aldi, the larger discounter, grew 0.4 percent, and Tesco, the largest grocer, 1.0 percent.1 Discounters held 22.4 percent of European grocery in 2025, 2.5 points more than in 2019, according to McKinsey and EuroCommerce.2 Worldwide, IGD, a research group, expects them to grow 4.8 percent a year to 2030, against 4.0 percent for grocery as a whole.3
Discounters build their offer on low prices: ALDI US asks manufacturers to "offer great quality products at a low price".4 Suppose a discounter pays a manufacturer less for each pack than a supermarket does, once every term is counted. For a manufacturer setting its 2027 terms, is it a worse customer than the supermarket, or a better one?
Britain's two big discounters are growing at very different rates in 2026, and their low prices can mean a lower net price for the manufacturer.
Why does a discounter look like the worst account?
Net price received is the list price less every trade term on and off the invoice. Ranked by it, a discounter that pays less for each pack sits near the bottom of a manufacturer's customer list. The Academy's Trade Terms lesson on customer tiering adds a second measure, the cost to serve, in a customer profitability matrix it credits to Shapiro and Rangan, because "revenue is not profit, and not all customers are equally profitable".
The customer profitability matrix
Net price received goes up the side. Cost to serve, everything it costs the manufacturer to keep the customer, goes along the bottom. Each is an index: the customer's figure divided by the portfolio average, times 100. The two lines at 100 split the chart into four account types. Carriage Trade pays a high price and costs a lot to serve. Passive pays a high price and costs little, often the most profitable type. Aggressive pays little and costs a lot, usually the least profitable. Bargain Basement pays little and costs little, "often profitable on a per-unit basis", and the lesson asks two questions of it: is the volume worth the share of the business it takes up, and is the account pulling down the price the manufacturer gets everywhere else?
What discounters publish about how they buy reads like a list of low costs to serve. ALDI US tells manufacturers to expect "simplified processes" and "high-volume, timely orders", prefers to deal with them directly, wants orders and invoices sent electronically, and requires display-ready cases for "both private label and national brand food items".4 Lidl US carried more than 4,000 items in late 2024, against 7,000 at other retailers.5 Panel data analyzed for Public Health England found that in 2015 to 2018 Aldi and Lidl "tend not to promote extensively".6 Promotions cost a manufacturer twice at a supermarket: the funding comes off the net price, and the planning and in-store execution sit in the cost to serve.
Some lines run the other way: ALDI US makes the manufacturer pay artwork fees and can require testing at an approved third-party facility,4 and the lesson lists "compliance and audit (especially for hard-discounter customers)" as a cost to serve.
A discounter may pay less for each pack, but what it asks of a manufacturer can cost less to provide, and the matrix weighs the two.
When does the cheaper customer earn more?
An invented cereal manufacturer sells the same 500-gram box to a supermarket and a discounter at a list price of 2.00 pounds. It receives a net price of 1.60 pounds a box from the supermarket and 1.52 from the discounter. The supermarket takes 4,750,000 boxes and the discounter 5,000,000, so each brings 7,600,000 pounds of net sales (1.60 times 4,750,000; 1.52 times 5,000,000). The cost of goods sold (COGS) is 0.84 pounds a box. The shelf prices are each retailer's own decision, and the example does not need them.
On a gross margin report, the discounter looks worse. The supermarket leaves 3,610,000 pounds after COGS (1.60 less 0.84 is 0.76 a box, times 4,750,000), 47.5 percent of its 7,600,000 pounds of sales. The discounter leaves 3,400,000 (1.52 less 0.84 is 0.68, times 5,000,000), 44.7 percent. The 210,000-pound gap is the cost of making the 250,000 extra boxes the discounter needs for the same revenue (0.84 times 250,000).
The cost to serve runs the other way. The supermarket costs 570,000 pounds a year: 150,000 for the account team and category planning, 140,000 for promotion planning and in-store execution, 190,000 in logistics on mixed pallets and frequent orders to many depots (4 pence a box), and 90,000 for disputes and one-off requests. The discounter costs 290,000: 30,000 for the account team, nothing for promotions in this example, 100,000 in logistics on full pallets to a few distribution centers (2 pence a box), 100,000 for display-ready cases and artwork (2 pence a box), 40,000 for audits and testing, and 20,000 for disputes.
The Academy's customer profit-and-loss lesson reads cost to serve as a share of net sales: 7.5 percent at the supermarket (570,000 divided by 7,600,000) and 3.8 percent at the discounter (290,000 divided by 7,600,000). Both sit inside its planning range of about 2 to 8 percent, though the tiering lesson warns that most teams' own figures run low.
The test, in one line
Customer profit = net sales minus the cost of goods minus the cost to serve. Divided by net sales, it is the customer profit-and-loss lesson's cost-to-serve-adjusted margin, here without the marketing line. It splits in two: the gross margin share less the cost-to-serve share. Of two customers with equal revenue, the one that pays less per unit has the lower gross margin share, since the same cost of goods comes off a lower price. It is the more profitable customer only if its cost-to-serve share is lower by more. In the example that is 3.7 points (7.5 less 3.8) against 2.8 (47.5 less 44.7): the discounter leads by about 0.9 points of sales.
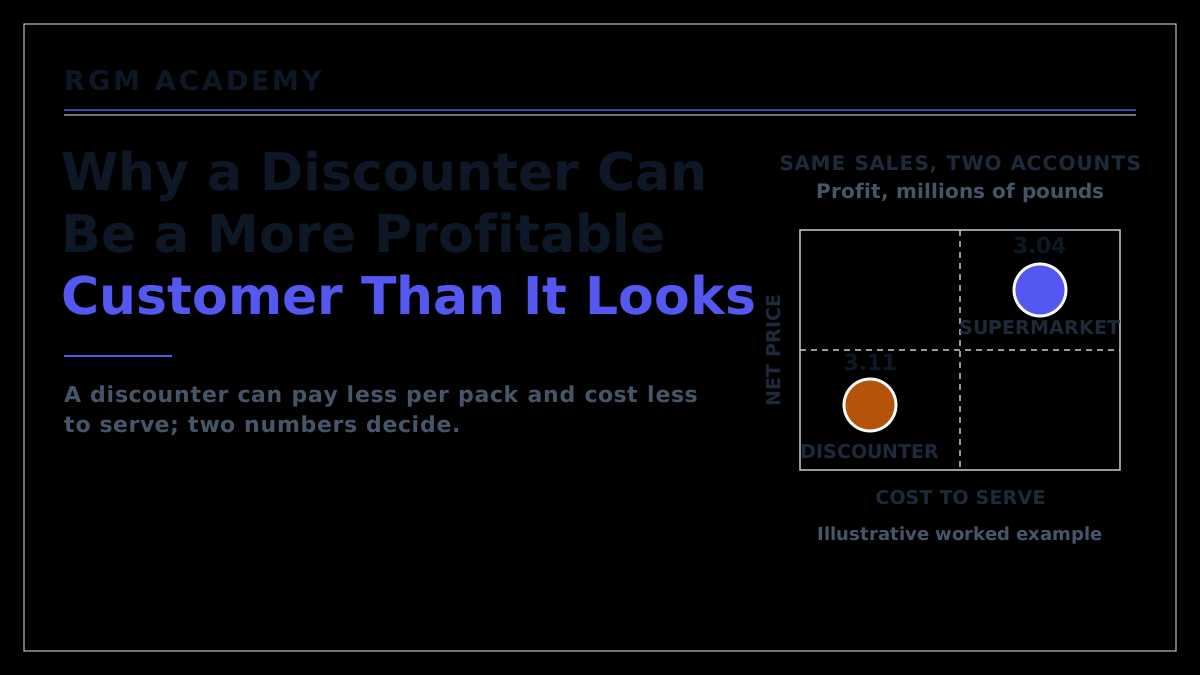
In pounds, the supermarket earns 3,040,000 (3,610,000 less 570,000), 40.0 percent of its sales. The discounter earns 3,110,000 (3,400,000 less 290,000), 40.9 percent. The 70,000-pound gap is the 280,000 saved on the cost to serve (570,000 less 290,000) less the 210,000 given up in gross margin. The discounter keeps that lead only while the supermarket costs more than 500,000 pounds a year to serve, 6.6 percent of its sales (the discounter's 290,000 plus the 210,000 gap).
On the matrix, the portfolio averages, the manufacturer's other accounts included, are 1.56 pounds of net price and 0.096 pounds of cost to serve a box. The supermarket is Carriage Trade, at 103 on net price (1.60 divided by 1.56) and 125 on cost to serve (its 570,000 pounds over 4,750,000 boxes is 0.12 a box, divided by 0.096). The discounter is Bargain Basement, at 97 and 60 (1.52 divided by 1.56; 290,000 pounds over 5,000,000 boxes is 0.058 a box, divided by 0.096). The lesson's own hard discounter, at 88 and 75, is Bargain Basement too and still earns near the bottom of the lesson's five example customers per unit.
At equal revenue, the customer that pays less per unit earns more only when its cost-to-serve advantage is larger than its gross margin gap, and the matrix places each account on both measures.
How does the test fail?
The lead is under one point of sales, and the tiering lesson's two Bargain Basement questions show how quickly it can go.
The first question is whether the volume is worth the share of the business it takes up. Per box, the supermarket still earns more: 0.64 pounds (3,040,000 divided by 4,750,000) against 0.622 (3,110,000 divided by 5,000,000). With spare capacity, the discounter is the better customer; with a full factory, each box sent to it instead of the supermarket gives up 1.8 pence (0.64 less 0.622).
The second is about the price the manufacturer gets elsewhere. If the supermarket points to the discounter and wins one penny a box off its own net price, the manufacturer loses 47,500 pounds there (0.01 times 4,750,000). The discounter's whole lead is gone at 1.47 pence a box (70,000 divided by 4,750,000).
A dedicated pack adds cost of its own. If the discounter asks for its own pack size, and line changeovers and packaging add 1 penny a box, that costs 50,000 pounds (0.01 times 5,000,000). The lead falls to 20,000 (70,000 less 50,000). With the one-penny concession at the supermarket as well, the discounter is 27,500 pounds behind (20,000 less 47,500), though a pack sold only at the discounter makes the two prices harder to compare and can shrink the concession.
The first objection a practitioner raises is that supplying a discounter helps grow the brand's rival, the discounter's own label, which is 90 percent of ALDI US's core range4 and more than 70 percent of Lidl US's assortment.5 Dropping the listing does not remove that rival, since Lidl US has said it is focused on carrying "fewer branded items" and the slot would likely go to private label. Each listing therefore deserves this test before it is given up.
The same discounter can be the more or the less profitable customer, depending on a few pence of cost and price that a manufacturer can measure before the negotiation.
Where should the investment go?
The tiering lesson pairs the matrix, which shows whether an account pays today, with a customer investment map, which shows where it is heading, and says to "read the two together before you set a customer's terms."
The customer investment map
Current value goes along the bottom: the account's net sales or margin contribution against the portfolio average. Growth outlook goes up the side: year-on-year growth against a line the lesson calls "clearly growing", with the growth of the account's channel counted too. Four investment tiers follow: Build (low value, high growth), Fuel (high value, high growth), Sustain (high value, low growth) and Optimize (low value, low growth). The lesson's advice is to protect and extend Fuel accounts and, for Sustain, "Hold the line".
Two discounters can share an account type on the matrix and sit in different tiers on the map. Suppose the manufacturer's sales to each customer grow at that retailer's latest rate, with the same profit per pound of sales. A discounter growing like Lidl, at 7.1 percent, earns 3,330,810 pounds a year later (3,110,000 times 1.071). The supermarket, growing like Tesco at 1.0 percent, earns 3,070,400 (3,040,000 times 1.01). The lead grows to 260,410 (3,330,810 less 3,070,400). A discounter growing like Aldi, at 0.4 percent, earns 3,122,440 (3,110,000 times 1.004), a lead of 52,040 (3,122,440 less 3,070,400). On this one 12-week reading the first is Fuel and the second, like the supermarket, is Sustain. The lesson places accounts once a contract cycle, "never on the strength of one weak quarter", and counts the channel's growth too, which for the Aldi-like account means the discount channel's 4.8 percent a year on IGD's forecast.
A growing, profitable discounter earns growth investment, but on objective, published conditions that keep it cheap to serve: volume, full pallets, electronic orders, display-ready cases. The lesson says the shelf price is not one of the conditions, because it is the retailer's decision.
A manufacturer should place each discounter on the profitability matrix and the investment map before agreeing 2027 terms, and tie any investment to conditions that keep the account cheap to serve.
References
- Worldpanel by Numerator, "British shoppers seek autumn staples, while grocery inflation edges up to 2.5%", 13 October 2026: "Over the 12 weeks to 4 October, Lidl led in market share gains, climbing to 8.6%, up from 8.2% at the same time last year. Sales at Lidl were 7.1% higher"; "Aldi now holds 10.5% of the market, with sales at the discounter up 0.4% year on year."; "Spending through the tills was 1.0% higher at Tesco and 1.3% higher at Sainsbury's". worldpanelbynumerator.com
- McKinsey and EuroCommerce, State of Grocery Retail Europe 2026, 21 April 2026: discounter market share "reached 22.4 percent in 2025, up 0.3 percentage points from 2024 and up 2.5 points since 2019". mckinsey.com
- IGD, Global discount trends 2026, reported by Retail Gazette, 20 March 2026: discounters "will grow at a compound annual growth rate of 4.8 per cent to 2030", against "the wider grocery market's 4.0 per cent." retailgazette.co.uk
- ALDI US, "Become a supplier" and supplier FAQs: "Offer great quality products at a low price that will provide our customers value"; "Private label capabilities (90% of our core range is private label)"; "When you partner with ALDI you can expect simplified processes that give you more time to invest in your business, while receiving high-volume, timely orders that allow you to plan ahead."; "Prefer to work directly with manufacturers or growers"; "Prefer to exchange business documents (Purchase Orders, ASNs, Invoices, etc.) via EDI"; display-ready cases "required for both private label and national brand food items"; "The supplier is responsible for artwork fees."; "we will request you send your product to an ALDI approved 3rd party testing facility". corporate.aldi.us; corporate.aldi.us/suppliers/faqs
- Store Brands, interview with Miguel Paradela of Lidl US, published around December 2024: "We're not carrying 7,000 items like other retailers, but our selection of more than 4,000 items"; "We're also focused on carrying more private label products and fewer branded items."; "More than 70% of our assortment is private label". storebrands.com
- Public Health England, analysis of Kantar Worldpanel data on price promotions, 2015 to 2018, published December 2020: "Aldi and Lidl, referred to as 'discounters', and who tend not to promote extensively increased market share during this period". gov.uk
Keep going
Pair this with the playbook and the lessons that teach the methods behind it.
Playbook
On-invoice or off-invoice. Whether the next trade dollar should go on the invoice or off it, and why the net price received has to count both.
More from the blog
On-invoice or off-invoice: where the trade dollar actually lands. Where the trade money lands, on the invoice or settled later, and why both have to be counted before two customers' net prices are compared.
Three ways brands are fighting back against private label. How brands respond once private label takes share, the model the discounters are built on.
The squeezed middle. Why shoppers trade down and up at the same time, with private label and discounters setting the floor.
Lessons inside the course
Customer tiering and criteria →The customer profitability matrix and the customer investment map, read together, with a practice tool that places six customers and sets their terms.Start the lesson → Customer P&L and profit pool →The full customer P&L, with the cost of goods and every cost-to-serve line, and the margin after cost to serve, which this article's test uses without the marketing line.Start the lesson → Gross-to-net and value split →How the list price comes down to the net price received, after every term on and off the invoice.Start the lesson →Try it free
Customer Profitability Matrix Builder. The tool opens on its own ten-customer portfolio. Add two customers, each starting at 100 on both measures, and enter this article's indexes: net price 103 and cost to serve 125 for the supermarket, 97 and 60 for the discounter. The first lands in Carriage Trade and the second in Bargain Basement, each with the lesson's advice on how to run it. Then enter your own two biggest customers. Free and without sign-up.