Why Store Brands Can Win the Units While Brands Win the Money
Unit share and the price gap each mislead; the revenue premium combines them.
The short version
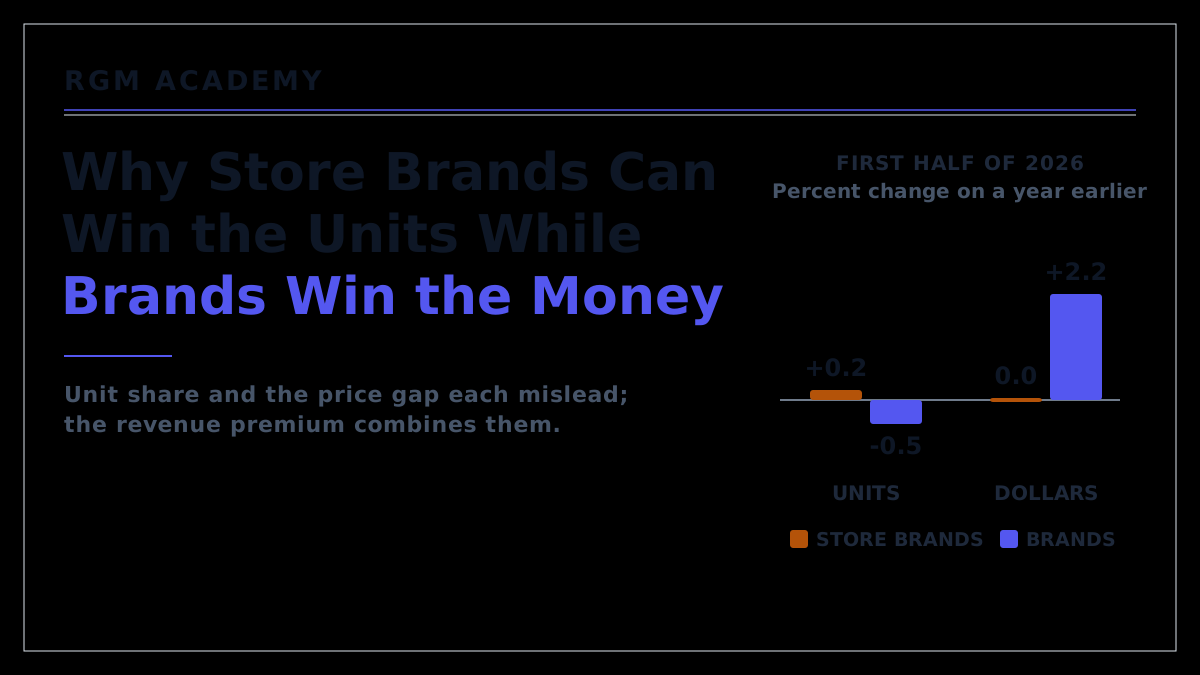
- In the first half of 2026 American store brands sold 23.8 percent of grocery units, a record by their trade body's count, while national brands grew their dollar sales by 2.2 percent and store-brand dollars stood still. In 2025 the store brands had won both races.12
- Unit share ignores price, and the price gap ignores volume, so neither tells a manufacturer what its brand is worth over the store brand next to it.
- The revenue premium measures it: the brand's revenue minus the store brand's, each at its own price and volume. In this article's worked example the brand's price gap widens and the shortcut most teams use (the gap times the brand's volume) rises 1.3 percent, while its revenue premium falls 20.9 percent.
- Which shoppers switch decides how much volume the brand loses. The occasional buyers leave first, so the shoppers who remain look more loyal on average while the brand has lost ground.
Who is winning, store brands or brands?
In 2025 American store brands grew their dollar sales nearly three times as fast as national brands, 3.3 percent against 1.2 percent, and won the unit race too. The figures come from the Private Label Manufacturers Association (PLMA), the store-brand industry's trade body, which reports Circana data.2 In the six months to 14 June 2026 store brands kept winning units, reaching 23.8 percent of them, which PLMA called an all-time high. The dollar race reversed: year to date, store-brand dollars were flat while national brands added 2.2 percent.1
PLMA's president, Peggy Davies, said the split reflects brands' pricing in part: some are cutting prices to win shoppers back, while others are raising prices to cover higher costs. She added that "unit sales remain the best measure of consumer choice".1 Circana, in its own commentary, points to shoppers trading up,3 so each side has a number that suits it.
In 2026 store brands kept winning units while brands won the dollars back, and neither headline shows what a brand is worth over the store brand next to it.
Why do unit share and the price gap each mislead?
Unit share counts shoppers' choices and ignores what they paid. The price gap, the brand's price over the store brand's, counts what they paid and ignores how many chose the brand. A brand can widen its gap and lose shoppers at the same time.
The gap reported for all categories together is also mostly a mix effect, set more by which categories and pack sizes sell than by any one brand's price. In the first quarter of 2026 the average store-brand unit sold for 4.11 dollars and the average national-brand unit for 4.79, a difference PLMA put at "68 cents or 17%".4 A manufacturer has to measure its own matched pair: its pack against the store-brand equivalent, at each retailer, per comparable unit.
Kusum Ailawadi, Donald Lehmann and Scott Neslin, who introduced the revenue premium, tracked packaged-goods brands from 1991 to 1996. One fabric-softener brand raised its price premium over the store brand by 71 percent while its volume premium, its units over the store brand's, fell 64 percent and its revenue premium 23 percent. The authors concluded that "the vast majority of brands charge a positive price premium but that many are unable to get a positive volume premium".5
The revenue premium
The Academy's lesson on brand power measures a brand and its store-brand equivalent "with their own real prices and their own real volumes": revenue premium = (the brand's volume times its price) minus (the store brand's volume times its price). The lesson warns against a common shortcut, (the brand's price minus the store brand's price) times the brand's volume, which "is a different quantity and it answers a different question", because it leaves out the store brand's volume. It adds two rules: leave out promotional weeks, and check which side moved before reading a change, since a premium that falls because the store brand's price rose is not the brand's doing. Both revenues are counted at the shelf prices shoppers paid, as in scanner data, so the premium measures shoppers' spending at the retailer, not the manufacturer's net sales.
Unit share and the price gap each measure half of a brand's position against the store brand, and the revenue premium puts the two halves together.
What does the revenue premium show that the price gap does not?
Take an invented brand of breakfast cereal and the store-brand box next to it at one retailer. Both shelf prices are the retailer's decisions; the manufacturer sets its list price. In the first half of 2025 the brand sold 1,000,000 boxes at 5.00 dollars, or 5,000,000 dollars. The store brand sold 800,000 at 3.40, or 2,720,000. The revenue premium was 2,280,000 dollars (5,000,000 less 2,720,000). The shortcut gives 1,600,000 dollars (the 1.60-dollar gap times 1,000,000 boxes).
In the first half of 2026 costs pushed prices up across the category. The manufacturer raised its list price, and the retailer moved the brand's shelf price to 5.25 dollars, up 5.0 percent. Its own store brand went to 3.50 dollars, up 2.9 percent. Assume the pair's total sales hold at 1,800,000 boxes, so every box the brand loses goes to the store brand. That is the case in which the premium falls most, because a box that leaves the category costs the premium only the brand's revenue. On the example shelf in the Academy's cross-price elasticity lesson (Pricing Lesson 6), about three-eighths of the lost volume goes to the store brand.
The Academy counts two effects when both prices move. The brand's own price rise costs it 7.75 percent of its volume, 77,500 boxes (its price sensitivity of 1.55 times 5.0 percent). The next section shows where the 1.55 comes from. The store brand's rise wins a little back. Pricing Lesson 6 measures that pull, the cross-price elasticity, at 0.08 to 0.20 for a brand against the store brand under it, and uses 0.12 on its own shelf. Each 1 percent on the store brand's price brings the brand 0.12 percent of its volume, here about 3,500 boxes (0.12 times 2.94 percent of 1,000,000 is 3,529). The brand loses about 74,000 boxes net, 7.4 percent of its volume.
Five readings then point different ways. The brand's price gap widened from 1.60 to 1.75 dollars, or from 47.1 to 50.0 percent of the store brand's price, the lesson's measure. The shortcut rose 1.3 percent, to 1,620,500 dollars (1.75 times 926,000). The brand's retail sales fell 2.8 percent, to 4,861,500 dollars (926,000 boxes at 5.25). Its share of the pair's units fell 4.1 points, from 55.6 to 51.4 percent of 1,800,000. The revenue premium fell 20.9 percent, to 1,802,500 dollars: the brand's 4,861,500 less the store brand's 3,059,000 (874,000 boxes at 3.50).
With a price sensitivity above 1, a brand's own price rise lowers its retail sales unless much of the shelf rises with it. Pricing Lesson 1 notes that a whole category moving together "faces a far shallower number". Here the brand's retail sales would have held only if it lost fewer than about 47,600 boxes, 4.8 percent (1 less 5.00 divided by 5.25). The store brand's rise would then have had to win back about 30,000 of the 77,500, five times the 5,900 given by the top of Pricing Lesson 6's range, a cross-price elasticity of 0.20.
The figure below splits the fall of 477,500 dollars. The brand's higher price on the boxes it kept added 231,500 dollars (25 cents times 926,000). Every box that switched cost the premium twice: 5.00 dollars of the brand's revenue lost and 3.40 dollars added to the store brand's, 8.40 dollars a box or 621,600 dollars on 74,000 boxes. The store brand's own price rise, the retailer's move, took off another 87,400 dollars (10 cents times 874,000).
Had the store brand stayed at 3.40 dollars, the brand would have lost the full 77,500 boxes. The premium would have fallen to 1,859,625 dollars (922,500 boxes at 5.25 less 877,500 at 3.40). So the store brand's rise cost the brand's premium a net 57,125 dollars: it added 75,500 dollars to the store brand's revenue (3,059,000 less 2,983,500) and won back only 18,375 for the brand (3,500 boxes at 5.25). That is why the lesson says to check which side moved.
A brand can widen its price gap, and look stronger on the shortcut most teams use, while its revenue premium falls by a fifth, because each shopper who switches to the store brand costs the premium twice.
Who switches, and what does that mean for the next price rise?
The Academy's lesson on brand power treats a brand's price sensitivity as a blend: "Your brand does not have one price sensitivity, it has a weighted average of several."
Blended price sensitivity
Blended sensitivity = (habitual share times habitual sensitivity) plus (regular share times regular sensitivity) plus (occasional share times occasional sensitivity). Each share is that group's part of the brand's volume. Each sensitivity is the percentage of its purchases the group drops for a 1 percent rise in the brand's own price, with other prices held still; a rival's price move is added separately, as its cross-price effect. The lesson's typical ranges are 0.5 to 1.0 for habitual buyers, 1.8 to 2.5 for regular buyers and 3.0 to 4.0 for occasional ones. Every point of volume moved from occasional to habitual buyers lowers the blend.
In the example, household panel data show habitual buyers with half the brand's volume and a sensitivity of 0.6, regular buyers with a quarter at 1.8, and occasional buyers with a quarter at 3.2. The blend is 1.55 (0.30 plus 0.45 plus 0.80). So the brand's own 5.0 percent rise costs 7.75 percent of its volume (1.55 times 5.0), 77,500 boxes: 15,000 from habitual buyers, 22,500 from regular ones and 40,000 from occasional ones. The occasional buyers held a quarter of the volume and supplied more than half of the loss.
After the rise the blend reads 1.49, because the most price-sensitive buyers have gone and the habitual share has edged up to 52.6 percent (485,000 of the 922,500 boxes left after the brand's own rise). Nobody became more loyal. The fall of 0.06 is as large as the one Pricing Lesson 5 credits to a good year of brand and product work.
Which buyers a brand keeps matters for its next price increase. In the original study, the market share of brands with a high revenue premium fell on average 0.183 percent for each 1 percent price increase, about a fifth of the 0.921 percent for brands with a low one (0.183 divided by 0.921). The study compared brands with each other rather than following one brand over time, so a falling premium is best read as a warning sign about pricing power.5 Lost buyers are also slow to return: in Simon-Kucher's survey of 14,000 shoppers in 14 countries, "only a quarter of consumers say they would return to brands" if prices fell.6
The buyers a brand loses on a price rise are mostly its occasional ones, so its remaining buyers can look more loyal on average while the revenue premium, which the original study links to pricing power, is falling.
What should a manufacturer track?
The revenue premium needs only scanner data, including the store brand's sales, so wherever a retailer's data cover its own label it can be computed for each matched pair, every quarter, and judged on a rolling year. Each change should be split into its price half and its volume half and read next to the number of shoppers buying the brand. The first question is which side moved.
For the store-brand benchmark, the original study's advice is to "identify a reasonable benchmark brand and use it consistently".5 Where a premium store-brand tier grows, a premium pack may need to be measured against it rather than the value tier.
The manufacturer's levers are its list price, its product, its pack and its brand investment. The shelf prices, and the gap between them, are the retailer's. A falling revenue premium also weakens the manufacturer in the next negotiation, because it shows how much of the brand's volume the retailer could move to its own label.
A manufacturer should track its revenue premium pair by pair, split it into price and volume, and check which side moved, because that, more than unit share or dollar sales, shows what the brand is worth over the store brand.
References
- Private Label Manufacturers Association (PLMA), reporting Circana data, 8 July 2026: "Over the six months ending June 14, store brand unit sales increased 0.2% while national brand unit sales declined 0.5%"; "Store brand unit market share rose to 23.8%, an all-time high"; "In dollar sales, store brands were flat year-to-date while national brands tacked on 2.2%. Store brand dollar share came in at 21.2%, just off its all-time high."; "While some brands are lowering prices to regain consumers who have shifted to private label, others are increasing prices to offset higher fuel, raw material, ingredient, and supply chain costs," said Peggy Davies, PLMA President. "Unit sales remain the best measure of consumer choice". plma.com
- PLMA, 20 January 2026, Circana data for the 52 weeks to 28 December 2025: "Store brand dollar sales increased nearly three times the rate of national brands, climbing 3.3%, compared to a gain of only 1.2% for their national brand counterparts"; store-brand units "a 0.6% rise, while national brands declined by -0.6%." plma.com
- Circana, CPG Demand Signals, 25 September 2026: "Premium mix effect holds as shoppers prioritize quality and health."; "Premium brands continue to win as consumers seek elevated everyday experiences, pressuring value and private label share." circana.com
- PLMA e-scanner, 11 April 2026, Circana data: "In overall Q1 dollar sales, store brands slipped 0.1% and national brands added 2.5%."; "On average, all store brand products sold during Q1 were priced at $4.11 per unit while all national brands were $4.79 each. The difference in price per unit was 68 cents or 17%". plma.com
- Kusum L. Ailawadi, Donald R. Lehmann and Scott A. Neslin, "Revenue Premium as an Outcome Measure of Brand Equity", Journal of Marketing 67(4), 2003: "the latter's price premium rose by 71%, but its volume premium declined by 64%"; "a 23% decrease in the revenue premium of the fabric softener brand"; "Of the brands, in 1991 33% were Case A; 55%, Case B"; "the vast majority of brands charge a positive price premium but that many are unable to get a positive volume premium."; "high-revenue-premium brands have an average down price elasticity of -.747 but an up price elasticity that is much less negative at -.183"; low-revenue-premium brands "-.921"; "We recommend that managers identify a reasonable benchmark brand and use it consistently." business.columbia.edu
- Simon-Kucher, Global Shopper Study 2026, 15 April 2026: "based on 14,000 consumers across 14 countries"; "If prices fall, only a quarter of consumers say they would return to brands." simon-kucher.com
Keep going
Pair this with the playbook and the lessons that teach the methods behind it.
Playbook
Responding to private label. What a brand can do when the store brand gains, and which responses tend to pay.
More from the blog
Three ways brands are fighting back against private label. The responses open to a brand once the measurement in this article shows where it is losing.
When matching a competitor's price cut destroys value. Why following a rival's price down rarely pays, including when the rival is a store brand.
Why 1 percent more in price beats 5 percent in volume. How much a point of price is worth to profit, and why the volume half still matters.
Lessons inside the course
Brand strength and pricing →The revenue premium, its common wrong version, the blended price sensitivity of habitual, regular and occasional buyers, and the Lerner index warning about a brand harvesting itself.Start the lesson → Cross-price elasticity →Why a brand loses more volume to the store brand when the brand's price rises than it wins back when the store brand's price rises.Start the lesson → Price elasticity →How a list price move reaches the shelf, which is the retailer's decision, and what one price sensitivity does to volume.Start the lesson →Try it free
Price Elasticity Calculator. This link opens it on the calculator's own biscuit pack at a 4.9 percent list price rise (4.29 to 4.50), close to the example's 5.0 percent, assuming the retailer passes it in full to the shelf. The sensitivity is 1.55, the example's blend, applied to the pack's own price. It shows the volume and gross profit that follow. The store brand's pull and the revenue premium are worked out by hand, as above. Free and without sign-up.