Why AI Pricing Tools Can Make Brands More Predictable Than Profitable
Where economists find algorithms raising margins, the gain comes from weaker competition between sellers.
The short version
- PepsiCo has not said what its AI pricing tools earn, and the benchmark it cites has no stated basis. Its June 2026 paper reports that in most markets about 85 percent of the promotion tool's recommendations were accepted, and that some tasks now take minutes instead of weeks.1 Its benchmark, a 2 to 5 percent improvement in revenue and profit, traces to a 2021 BCG estimate of 2 to 5 points of EBITDA margin, a far larger gain. EBITDA is a measure of operating profit.2
- Rivals can buy similar tools and often the same market data, which makes each manufacturer's moves easier for the others to predict.
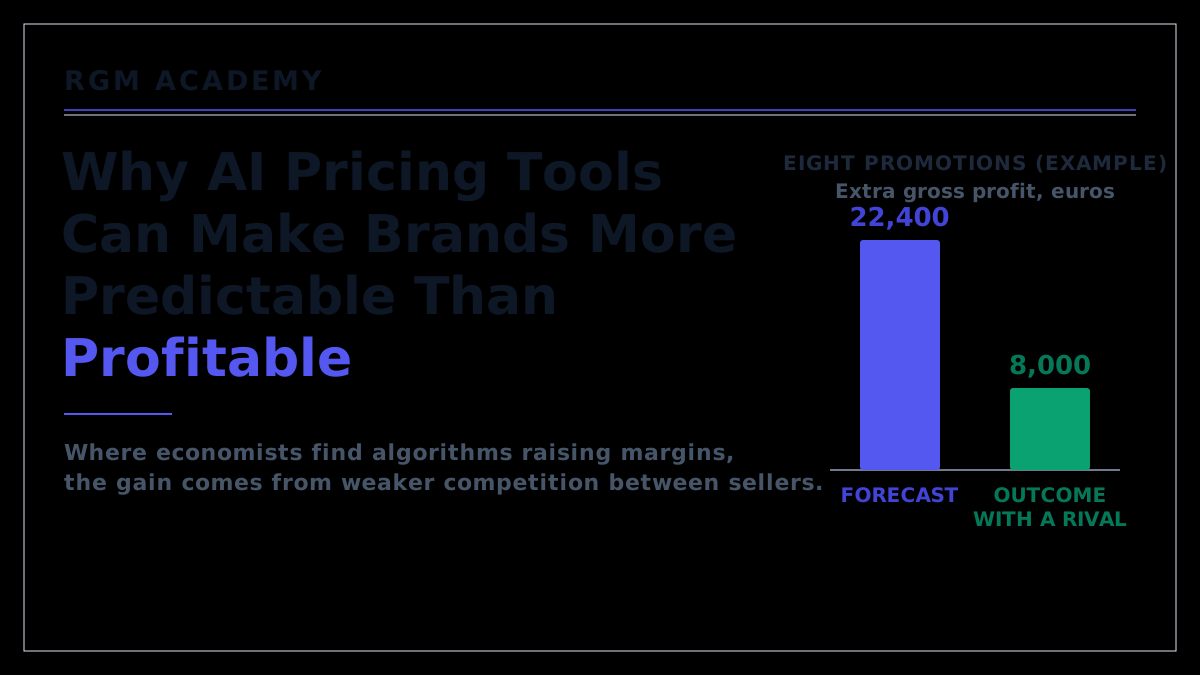
- A plan that assumes no rival will respond overstates its profit. In the worked example, a promotion plan that is forecast to add 22,400 euros to a snack manufacturer's gross profit adds 8,000 once a rival responds to four of its eight events.
- Where economists find algorithms raising margins across a market, the gain comes from weaker competition. Regulators now pursue tools that pool rivals' data. The other way margins rise, by repricing faster than rivals, usually favors the retailer in grocery.
What have AI pricing tools been shown to earn?
Nine authors from PepsiCo described in June 2026 how the company uses AI to plan its promotions and its pricing. In most markets about 85 percent of the promotion tool's recommendations were accepted. What the promotions earned is not reported, because "specific financial figures are commercially sensitive and cannot be disclosed".1
In their place the paper cites an industry benchmark of "2.0-5.0% improvements in both revenue and profit", taken from a 2021 BCG article. That article says AI-based tools "can boost EBITDA by 2 to 5 percentage points", with no study or client base for the range.2 A gain measured in points of margin is the far larger claim. EBITDA, earnings before interest, tax, depreciation and amortization, is a common measure of operating profit. At a 15 percent margin, two more points on the same sales raise EBITDA by 13 percent (2 divided by 15). A 2 percent rise in profit is less than a sixth of that.
A 2017 study in the journal Operations Research used one grocery retailer's data to estimate that an optimized promotion schedule could raise the retailer's profit by about 3 percent, or 5 percent if some business rules were relaxed. It is a model estimate; no store test is reported.3
Public evidence of what these tools add to a manufacturer's profit is thin, so each manufacturer has to measure the gain itself, with some retail accounts or regions planned with the tool and some without.
What are companies using AI pricing for?
In a 2025 survey by Simon-Kucher, a pricing consultancy, 72 percent said they used AI in pricing. The most common use, named by 41 percent, was gathering market intelligence: analyzing competitors' prices and customers' sensitivity to price.4
Rivals in consumer goods feed their tools much the same inputs: manufacturers in a category often buy their market data from the same few providers, so they share one sales history and its gaps in coverage. Their models make similar assumptions. PepsiCo's pricing model rules out any estimate in which a 1 percent price rise cuts sales by more than 2.5 percent, and assumes that competitors' prices move in step with the price of a matching PepsiCo product.1 A rival with a similar tool will probably make the same reasonable choices, so both tools are likely to be wrong in the same direction when the market changes.
Any lasting advantage lies in what a rival does not have: a manufacturer's own shipment and account data, its own tests of list prices, packs and promotion mechanics, and the judgment of whoever decides when to overrule the model. Those tests show what shoppers are willing to pay for the brand, which is what its list price should rest on. Competitors' prices are one input, and costs set only the floor.
A tool that rivals can buy, fed with data they can also buy, is unlikely to do more than keep a manufacturer level with them.
What does it cost a manufacturer to be predictable?
Software that reads competitors' history reads the manufacturer's own history too. The Academy's lesson on calendar optimization tells planners to pull two to three years of each rival's promotions from market data, because a rival's "next year's calendar will likely resemble their last". Tools that learn from the same seasonal pattern also point rivals at the same best weeks, so two manufacturers can clash without either one reading the other.
An invented snack manufacturer normally sells one retailer 10,000 units a week, or 20,000 over two weeks. It receives 2.50 euros a unit after its everyday trade terms, and each unit costs 1.50 euros to make. That leaves 1.00 euro of gross profit a unit (2.50 less 1.50). For a two-week promotion it pays the retailer 0.40 euros on every unit sold and a fee of 4,000 euros for a leaflet feature. The shelf price during the promotion, and so how much of the 0.40 euros reaches shoppers, is the retailer's decision; no figure below is calculated from it.
The net incremental profit bridge
The Academy's promotion lesson values an event in three steps. Net incremental volume is the uplift, the units sold above normal, less units that are not new, such as sales lost in the dip after the event. Incremental gross profit is that volume times the gross profit a unit at the manufacturer's regular net price. Net incremental profit is incremental gross profit less the total promotional investment, including the funding paid on units that would have sold anyway.
With no rival on promotion, the manufacturer sells 2.4 times normal, or 48,000 units (2.4 times 20,000). The uplift is 28,000 (48,000 less 20,000). Shoppers who stocked up then buy 2,000 fewer units over the next two weeks, so net incremental volume is 26,000 units, worth 26,000 euros of gross profit at 1.00 euro a unit. The investment is 23,200 euros: 19,200 of funding (0.40 times 48,000) and the 4,000 euro fee. The promotion adds 2,800 euros to the manufacturer's gross profit (26,000 less 23,200).
Suppose a rival promotes in the same weeks and cuts the uplift by a quarter, to 21,000 units. Net incremental volume falls to 19,000 units (21,000 less the dip), worth 19,000 euros. The investment falls only to 20,400 euros: 16,400 of funding (0.40 times the 41,000 units sold, 20,000 normal plus 21,000 uplift) and the 4,000 euro fee. Each unit of uplift lost to the clash removes 1.00 euro of gross profit and saves only 0.40 euros of funding. The manufacturer ends 1,400 euros worse off than with no promotion (19,000 less 20,400).
If the rival instead promotes in the two weeks after and takes 3,000 units of the manufacturer's sales, the dip grows to 5,000 units. Net incremental volume falls to 23,000 (28,000 less 5,000). Against the same 23,200 euros of investment, the manufacturer ends 200 euros worse off.
The head-to-head penalty
The head-to-head penalty is the share of a promotion's uplift lost when a competitor promotes in the same weeks. Here the clash costs 7,000 of the 28,000 units, or 25 percent (7,000 divided by 28,000). The Academy's calendar lesson tells planners to expect 15 to 30 percent. A manufacturer can measure its own figure from past clashes in its market data.
Over a year of eight such promotions, a tool that plans each one as if no rival will respond forecasts 22,400 euros of extra gross profit (8 times 2,800). If a rival responds to four of them, two in the same weeks and two just after, the year brings in 8,000 euros. The four unanswered events earn 11,200 (4 times 2,800); the two clashes lose 2,800 (2 times 1,400) and the two answered just after lose 400 (2 times 200). The forecast was 2.8 times what the year earned (22,400 divided by 8,000).
To break even in a clash, the event must earn 26,000 euros of gross profit after funding, enough to cover the 4,000 euro fee, the 2,000 euro dip and the 20,000 euros the two weeks would earn without a promotion. At 0.60 euros a unit (1.00 less 0.40) that takes 43,333 units (26,000 divided by 0.60), or 23,333 more than normal. A clash keeps only three-quarters of the uplift, so with no rival the event would need an uplift of 31,111 units (23,333 divided by 0.75). That is 51,111 units in all, or 2.56 times normal (51,111 divided by 20,000).
The manufacturer's promotions sell 2.4 times normal, so they lose money whenever a rival answers them. The plan still adds 8,000 euros, and the case is for redesigning these events rather than cutting them. A feature fee 1,400 euros lower, 2,600 instead of 4,000, would remove the 1,400 euro loss and let each event break even in a clash, provided the smaller feature still sold 2.4 times normal.
Being harder to predict has a cost too, and the expected-value test in the Academy's war gaming lesson shows when it is worth paying. Suppose that moving an event three weeks away from its best week leaves it selling only 2.2 times normal. It then adds 400 euros instead of 2,800 (44,000 units at 0.60 euros is 26,400, less the 4,000 euro fee, the 20,000 euros of two ordinary weeks and the 2,000 euro dip). If a rival's answers split evenly between clashes and the weeks after, an answered event loses 800 euros on average (the average of the 1,400 and 200 euro losses). That is 3,600 euros below the 2,800 an unanswered one earns (2,800 plus 800). Giving up 2,400 euros (2,800 less 400) pays only if a rival would otherwise answer more than two in three events (2,400 divided by 3,600). The test also assumes that the move stops the rival answering at all.
A forecast that ignores rivals' responses can overstate what a promotion plan earns, in this example nearly three times over.
Where does the extra margin in the research come from?
Economists who find algorithms raising margins across a market trace the gain to weaker competition. A study of Germany's retail fuel market, where many stations adopted pricing software, found that in local markets with two or three competing stations, margins rose only when all of them had adopted it. The study does not show how the software weakened competition. Its authors raise two possible routes: one vendor acting as a hub between the stations it served, or each station's own software reacting to the other stations' prices.5
Regulators now treat the first route, a shared tool or pooled data, as a legal risk. The European Commission's guidelines of 2023 say that feeding pricing software with public data is legal, but that pooling commercially sensitive information in a tool to which competitors have access "could amount to horizontal collusion", that is, collusion between competitors.6
Two American appeals courts have reached different results on different facts. In August 2025 one upheld the dismissal of a case against Las Vegas hotels that had each bought the same pricing software, which did not pass any hotel's confidential data to the others. In July 2026 another revived a case against Atlantic City casino hotels whose software allegedly pooled competitors' non-public data. Because AI tools adapt to new data, the court noted, "collusive conduct may occur at later points in time when other competitors begin to share their non-public commercial data with the software".7
The second route needs no shared data. In a model calibrated to five large online sellers of allergy medicines, two economists found that a firm whose software reprices faster than its rivals can make a believable promise to beat whatever price they set. Rivals that know this compete less hard: in the model, average prices rose by 5.2 percent and profits by 9.6 percent.8 The advantage goes to whoever reprices fastest, and in grocery that is usually the retailer. A manufacturer's list price takes weeks to change, because each retailer has to accept it, while a retailer can change its shelf prices the same afternoon.
A manufacturer that keeps its data out of shared tools, and whose list price moves more slowly than its retailers' shelf prices, gains from neither route. The strongest case for its tools is that they plan better: fewer errors, calendars that stay within each retailer's rules, and faster work, with some of PepsiCo's tasks falling from weeks to minutes.1 For many mid-sized manufacturers, judging promotions with no analysis at all is still a larger risk than being predictable. A steady rhythm of promotions also has value to a retailer and a factory that plan their year around it.
The evidence supports the case for better planning more than it supports any promise of higher margins.
Which decisions should stay with people?
Promotion planning, PepsiCo's authors write, "operates in a data-rich environment with discrete, reversible decisions", while strategic pricing "faces severe data limitations due to infrequent price changes".1 List price and the response to a rival's move are harder to reverse and rest on less data. What the tool is told to maximize, and the profit floors it must respect, express the company's strategy. These belong with named people, as do the negotiation with each retailer and the options the key account manager puts to the retailer.
In the Atlantic City case, where the software allegedly pooled rivals' data, the appeals court said that an alleged "90 percent compliance rate certainly supports an inference of an agreement" between the hotels.7 For a tool a manufacturer runs on its own data, a high acceptance rate raises a management question: whether people are still checking the advice or simply accepting it. Research on automation bias, the habit of deferring to a machine's advice, finds it in experts and teams as well as in novices and individuals, and finds that training does not prevent it.9 The useful records are a company's own: which recommendations were overridden, what each override earned, and which accepted recommendations lost money.
RealPage, an American maker of rent-pricing software, agreed in a settlement with the Department of Justice in November 2025 to stop its software using competitors' non-public data and to use non-public data in training only once it is at least 12 months old.10 The settlement's terms suggest four questions to put to any pricing, promotion or benchmarking vendor in writing. Does the manufacturer's non-public data feed recommendations its competitors receive? Does competitors' non-public data feed the recommendations it receives? Does any feature limit price cuts or align prices across users? How old is any non-public data used in training?
The EU guidelines also warn that a retailer can act as a hub that relays information between manufacturers, so a manufacturer should not ask a retailer, a vendor or a data provider which weeks a rival has booked, and should give a retailer its own future prices and promotion plans only for that retailer's own planning.6 This article is not legal advice. The rules differ between the EU, American states and other countries, so vendor contracts and data-sharing terms need competition counsel in each place where a manufacturer sells.
Manufacturers that test each event against a rival's likely response, and that know what their vendors do with their data, will have a clearer measure of what their tools earn than an acceptance rate or a vendor's benchmark.
References
- Nine PepsiCo authors, "PepsiCo Deploys AI-Driven Pricing and Promotion Optimization at Scale", arXiv 2606.17941, 16 June 2026 (INFORMS Journal on Applied Analytics): "In most markets, about 85% of PromoAI's optimized promotional recommendations were accepted and executed by the business"; "a meaningful signal of organizational trust"; "While specific financial figures are commercially sensitive and cannot be disclosed, industry benchmarks suggest that AI-enabled pricing tools can drive 2.0-5.0% improvements in both revenue and profit"; "Promotional planning operates in a data-rich environment with discrete, reversible decisions"; "strategic pricing faces severe data limitations due to infrequent price changes"; "own-price elasticities expected in the range (-2.5, 0)"; "competitor prices adjust in proportion to their associated PepsiCo 'hero' product"; "compressed planning and execution cycles from weeks to minutes for specific pricing and promotional tasks". arxiv.org
- BCG, "Why AI Transformations Should Start with Pricing", 7 June 2021: "The speed, sophistication, and scale of AI-based tools can boost EBITDA by 2 to 5 percentage points." bcg.com
- Cohen, Leung, Panchamgam, Perakis and Smith, "The Impact of Linear Optimization on Promotion Planning", Operations Research 65(2), 2017: an optimized schedule "could potentially increase the profit by 3%", and "a potential profit increase of 5% if some business constraints were to be relaxed". scholars.cityu.edu.hk
- Simon-Kucher, Global Pricing Study 2025, over 2,200 business leaders in 28 countries: "72% of respondents use AI in pricing"; "The most common use case today? Gathering market intelligence. 41% of respondents are using this data to analyze competitor pricing and customer pricing sensitivity". simon-kucher.com
- Assad, Clark, Ershov and Xu, "Algorithmic Pricing and Competition: Empirical Evidence from the German Retail Gasoline Market", Journal of Political Economy 132(3), 2024: "In duopoly and triopoly markets, margins increase only if all stations adopt, suggesting that AP has a significant effect on competition". The 2020 working-paper version (CESifo 8521) put the rise at 28 percent "in markets where both do". The 2020 conference draft: "The adoption of the same software by numerous brands may lead to a concern for a hub-and-spoke scenario or the parallel use of individual algorithms scenario". ideas.repec.org; ifo.de; nber.org
- European Commission, Guidelines on the applicability of Article 101 to horizontal co-operation agreements, adopted 1 June 2023: "Whilst using publicly available data to feed algorithmic software is legal, the aggregation of commercially sensitive information into a pricing tool offered by a single IT company to which various competitors have access could amount to horizontal collusion"; "a distributor or retailer may act as a hub to relay information to multiple manufacturers or suppliers." europa.eu
- US Court of Appeals for the Ninth Circuit, Gibson v. Cendyn Group, 15 August 2025, affirming the district court's dismissal: "the competing hotels independently purchased licenses for the same software"; "This analysis might change if Plaintiffs had alleged that Cendyn shared the confidential information of each competing hotel among the licensees." Third Circuit, Cornish-Adebiyi v. Caesars Entertainment, 29 July 2026: the software allegedly gave "each client the benefit of their competitors' non-public data"; "because AI-driven tools can adapt and adjust based on new data, collusive conduct may occur at later points in time when other competitors begin to share their non-public commercial data with the software"; "The alleged 90 percent compliance rate certainly supports an inference of an agreement between casino-hotel defendants to price rooms consistent with Cendyn's suggestions." uscourts.gov (Ninth Circuit); uscourts.gov (Third Circuit)
- Brown and MacKay, "Competition in Pricing Algorithms", Federal Trade Commission conference version, 2020, from which the figures are taken (published in American Economic Journal: Microeconomics, 2023): "A superior-technology firm commits to 'beat' (best respond to) whatever price is offered by its rivals, and its investments in frequency or automation makes this commitment credible. The rivals take this into account, softening price competition"; "average prices by 5.2 percent across the five firms. This corresponds to a 9.6 percent increase in profits". ftc.gov
- Parasuraman and Manzey, "Complacency and Bias in Human Use of Automation: An Attentional Integration", Human Factors 52(3), 2010: "Automation bias occurs in both naive and expert participants", "cannot be prevented by training or instructions" and "can affect decision making in individuals as well as in teams". trid.trb.org
- US Department of Justice, 24 November 2025, on the settlement with RealPage: RealPage must "Cease having its software use competitors' nonpublic, competitively sensitive information", with model training limited "to historic or backward-looking nonpublic data that has been aged for at least 12 months". justice.gov
Keep going
Pair this with the playbook and the lessons that teach the methods behind it.
Playbook
Match a competitor's price or hold. Five questions to answer before responding to a rival's price cut, with the case of Marlboro Friday in 1993.
More from the blog
When matching a competitor's price cut destroys value. The break‑even test for answering a rival's move, the reactive decision this article's calendar test plans for in advance.
The case for ending half your promotional plan. Which events to cut, shrink or keep, once each one has been scored against a rival's likely response.
Dear agent: a brand's guide to selling to software. The other side of AI in consumer goods: shoppers' own software agents comparing prices and packs.
Lessons inside the course
War gaming →Reading a competitor's pattern, how fast each side can move, and expected value across a rival's likely responses.Start the lesson → Promo ROI fundamentals →The net incremental profit bridge this article's snack example runs: the genuinely new units, valued at the regular gross profit, less the funding paid on every unit sold on deal and the fees.Start the lesson → Calendar optimization →The head-to-head penalty, the gain to a rival who promotes just after you, and the value of a steady promotional rhythm.Start the lesson → Cross-price elasticity →How a rival's prices move your sales, and working out what a competitor will do next.Start the lesson →Try it free
Promo ROI Calculator. Build a promotion's net incremental profit, from the gross profit of its genuinely new units down to what the deal costs, as this article's snack example does. Free and without sign-up.