Why a Brand's Good-Better-Best Range Now Competes With the Retailer's Own Label: The Case of Tesco Finest
Retailers now run three own-label rungs, so brands must check gaps rung by rung.
The short version
- Sales of Finest, Tesco's premium own-label range, rose 8.9 percent in the UK in the 26 weeks to 29 August 2026, four times the pace of Tesco's total UK sales. At the bottom of its range, the same retailer matches Aldi's prices on about 700 lines. With its standard own label in between, the retailer now runs a ladder of three price rungs.
- The Academy's good-better-best gap rules, which the lesson runs once against the store brand, have to be run against each rung of that ladder. In a worked example, a brand's Good sits a healthy 16.1 percent above the standard own label, while its Best sits only 8.3 percent above the premium own label.
- A premium own label priced between a brand's Better and its Best takes the middle seat, so for shoppers who compare those three, the compromise effect, which favors the middle option, can work for the retailer's line.
- The tier numbers can hide the loss. When two percentage points of category volume move from Best to the premium own label, the top tier looks unchanged. The brand's share of the tier falls from 42.9 to 31.4 percent, and the brand's profit falls 6.1 percent.
What is Tesco building at both ends of its range?
Tesco's interim results on 8 October 2026 describe both ends of its range. In the UK, Finest sales grew 8.9 percent, with "over 350 new and improved products launched". Tesco's total UK sales rose 2.1 percent over the same 26 weeks. At the other end, Tesco calls itself the "cheapest full-line grocer, with c.700 Aldi Price Match products".1
Other British retailers are building the same ladder. Sainsbury's said in February 2026 that its Taste the Difference range had passed 2 billion pounds in sales, and that "over 60 per cent of our customers shop both Aldi Price Match and Taste the Difference in the same basket".2 Over Christmas 2025, Worldpanel found premium own label growing 9 percent and taking 7.5 percent of all grocery sales, up from 7.1 percent a year earlier.3 Morrisons and Lidl report premium ranges growing faster than their business as a whole, and Aldi says its premium range grew 11 percent, "driven by a switch from branded products".456 Almost as many shoppers buy the premium rung as the basic one across 14 countries. In Simon-Kucher's 2026 study of 14,000 consumers, 34 percent frequently buy basic own label and 30 percent buy premium.7
The retailer now runs a ladder of its own, from price-match lines through a standard own label to a premium own label, so a brand's good-better-best range meets it at the top as well as at the bottom.
How do the Academy's gap rules work against two ladders?
The Academy's lesson on good-better-best sets out how far apart a brand's rungs should be, and how far its cheapest rung should sit above the store brand.
The gaps the lesson checks
Good to Better gap = (Better price - Good price) / Good price, with a target of 15 to 25 percent; the Better to Best gap works the same way. The compound gap from Good to Best is (1 + Good-to-Better gap) x (1 + Better-to-Best gap) - 1, and the lesson expects it "around 32 to 56%". The lesson's price gap to private label, called the private label gap here, is (Good price - private label price) / private label price. On that gap the lesson says: "Healthy is 15 to 25 percent. Below 10 percent there is no visible reason to pay more. Above 30 percent you have left a lane wide open for downtrading." The Academy's lesson on price tiers measures the step between whole tiers the same way, as the tier gap, and warns that above 30 percent "a 'no man's land' opens between tiers".
The lesson runs the private label gap once, for Good. Running it at every rung of a store-brand ladder is this article's own extension of the lesson.
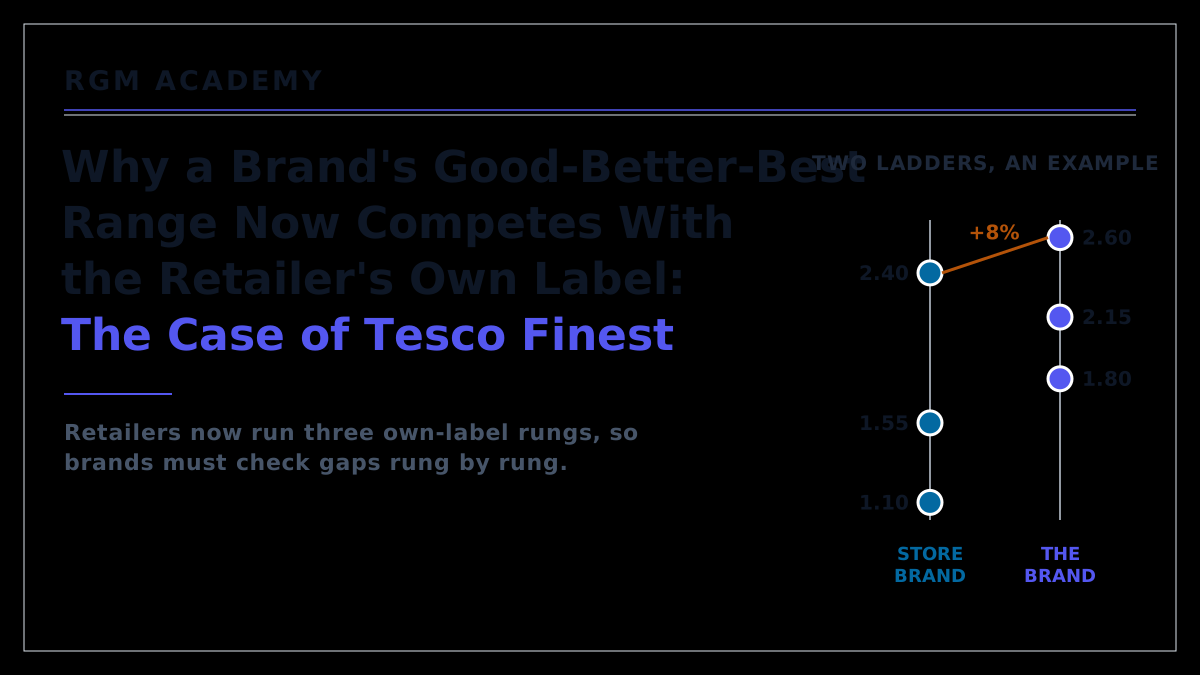
Take an invented brand in one category at one retailer, with every pack the same size. The shelf prices are the retailer's decisions; the example takes them as observed. The brand's ladder is Good at 1.80 pounds, Better at 2.15 and Best at 2.60. Its own gaps meet the lesson's targets: Good to Better is 19.4 percent (0.35 divided by 1.80), Better to Best 20.9 percent (0.45 divided by 2.15), and the compound gap 44.4 percent (2.60 divided by 1.80, less 1).
The retailer's ladder is a price-match line at 1.10, a standard own label at 1.55 and a premium own label at 2.40. Its steps, measured like the price-tiers lesson's tier gap, are 40.9 percent (0.45 divided by 1.10) and 54.8 percent (0.85 divided by 1.55). Both are well past 30 percent, the level where that lesson warns a no man's land opens between tiers. The brand's Good and Better sit inside the second step, which is the brand's real role on this shelf: it fills the space the retailer's own ladder leaves open.
Run at each rung, the private label gap shows Good 16.1 percent above the standard own label (0.25 divided by 1.55), inside the lesson's healthy band of 15 to 25 percent but near its floor. The lesson measures Good against what it calls "the cheapest credible option", taken here to be the standard own label; against the price-match line, Good sits 63.6 percent higher (0.70 divided by 1.10).
Best is 8.3 percent above the premium own label (0.20 divided by 2.40), under the 10 percent at which, in the lesson's words, "shoppers stop seeing why they should pay more". As an index, the price-tiers lesson's relative price by tier (the brand's price divided by the own label's, times 100) reads 116.1 at the entry rung and 108.3 at the top.
A brand can pass the private label gap test against the standard own label and still have no visible step at the top, so the test has to be run at each rung of the retailer's ladder.
Who takes the middle seat?
The compromise effect says that when shoppers see three options together, more of them choose the middle one. The good-better-best lesson writes it as Compromise effect = Better share (3 tiers) - Better share (2 tiers): the share that Best, by making Better look reasonable, hands to Better.
A premium own label priced between Better and Best changes which option is in the middle. In the example it sits at 2.40 pounds, 11.6 percent above Better (0.25 divided by 2.15) and below Best at 2.60. For a shopper comparing Better, the premium own label and Best, the middle option is now the retailer's. That step of 11.6 percent is also below the lesson's target of 15 to 25 percent, so a shopper ready to trade up from Better can stop at the retailer's line instead of going on to Best. The lesson describes what happens when a rival's next rung sits close above a brand's: "shoppers trade across brands rather than up within yours".
There is a second reading. For a shopper who compares Good, Better and the premium own label, the premium line can make Better look reasonable, as the brand's own Best was meant to. But the lesson says the effect is stronger when "all three options are seen at once", and the retailer's shelf layout decides which three a shopper sees together. So the brand would be unwise to count on this friendly reading.
Between a brand's Better and Best, a premium own label becomes the middle option, so the compromise effect a brand built its ladder on can work for the retailer's line.
What do the tier numbers hide?
The Academy's lesson on price tiers reads a category tier by tier, then the brand inside each tier, because "the same brand can be at parity in one tier and 15 percent above the same rival in another".
Reading the tier, then the brand inside it
V/V Ratio = Tier Value Share / Tier Volume Share: a tier's share of category value divided by its share of category volume. A ratio above 1 means the tier earns more than its weight in units. Share of Tier = (Brand Volume in Tier / Total Tier Volume) x 100. Relative Price by Tier = (Brand average price in the tier / competitor average price in the tier) x 100.
In the example, one week at this retailer sells 10,000 packs. The retailer sells 2,000 packs each of its price-match line and standard own label, and 1,000 of its premium own label. The brand sells 1,500 packs of Good, 2,750 of Better and 750 of Best, 5,000 in all. At shelf prices the week is worth 18,262.50 pounds (each line's packs times its shelf price, added up). The top tier holds the premium own label and the brand's Best. It sells 1,750 packs, 17.5 percent of volume. At shelf prices those packs are worth 4,350 pounds (1,000 x 2.40 plus 750 x 2.60), or 23.82 percent of value (4,350 divided by 18,262.50). The tier's V/V ratio is 1.361 (23.82 divided by 17.5). Best's share of tier is 42.9 percent (750 divided by 1,750).
Now move two points of category volume, 200 packs, from Best to the premium own label. The top tier still sells 17.5 percent of volume, and its V/V ratio barely moves, to 1.352, because the retailer's line is only 20 pence cheaper. Category value falls by 40 pounds (200 x 0.20), 0.2 percent. A team reading only the tier's volume share and V/V ratio sees nothing.
The brand's own numbers move a lot. Its share of the top tier falls from 42.9 to 31.4 percent (550 divided by 1,750). For profit, the good-better-best lesson uses Portfolio profit = sum over the rungs of (volume x price x margin). Here the price is the manufacturer's net price after trade terms, assumed at 1.20 pounds for Good, 1.45 for Better and 1.80 for Best. The assumed margins are 30 percent on Good, 38 on Better and 45 on Best. Before the move the brand earns 2,662.75 pounds a week: 540.00 on Good (1,500 x 1.20 x 0.30), 1,515.25 on Better (2,750 x 1.45 x 0.38) and 607.50 on Best (750 x 1.80 x 0.45).
A Best pack earns 0.81 pounds (1.80 x 0.45) against 0.55 for Better (1.45 x 0.38). So Best earns 22.8 percent of the brand's profit (607.50 divided by 2,662.75) on 15 percent of its packs. The lesson expects that of a top rung: 10 to 15 percent of volume, 20 to 30 percent of profit. The 200 packs that move cost the brand 162 pounds a week (200 x 0.81), and its profit falls to 2,500.75 pounds. It loses 4.0 percent of its packs (200 divided by 5,000) and 6.1 percent of its profit (162 divided by 2,662.75).
The retailer may welcome the move. The example assumes, leaving value added tax aside, that the retailer buys the premium own label at 1.30 pounds and Best at the brand's net price of 1.80. It then keeps 1.10 pounds a pack on its own line (2.40 less 1.30) against 0.80 on Best (2.60 less 1.80). The 200 packs that move add 60 pounds of margin (200 x 0.30). The gain is 3.5 percent of the 1,700 pounds the top tier earned it before (1,000 x 1.10 plus 750 x 0.80). That margin comes before the retailer's own costs of developing and marketing its premium range, which a buying price does not show.
The Academy's free Cross-Lever Impact Simulator shows a milder form of the effect on its own biscuit portfolio, in dollars, because in the tool the packs stay with the brand and move to its mainstream line. The premium mix is the share of its volume sold as premium packs. Lowering it by two points, from 25 to 23 percent, cuts gross profit 1.6 percent, and raising it to 35 percent adds 8.1 percent.
Tier-level ratios can hold steady while a brand loses ground on its top rung, so the brand's share of each tier and its relative price within it are the numbers to watch.
What can a manufacturer do about a gap it does not set?
The strongest objection is that shelf gaps belong to the retailer, so measuring them changes nothing for a brand, and that brands are winning back ground anyway. Worldpanel found branded sales growing faster than own label in the four weeks to 6 September 2026, 3.7 percent against 2.9 percent, "for only the second time in the past year".8 One month of faster branded growth says little about any one brand's top rung. In the worked example, the brand loses 4.0 percent of its packs but 6.1 percent of its profit, because the packs it loses are its most profitable.
Measuring is how the manufacturer decides its own moves; the shelf price stays the retailer's. The gap a shopper sees may also be between member prices, the lower prices a retailer gives holders of its loyalty card, and Tesco runs more than 10,000 Clubcard Prices.1 The good-better-best lesson says to "recalculate every gap on promoted prices, not shelf prices", so a manufacturer observes the gaps at member prices as well.
Four choices follow from the numbers, all of them the manufacturer's alone.
- Quality. The lesson's justified premium compares quality scores: (brand quality score - own-label quality score) / own-label quality score. If shoppers rate Best only slightly above the premium own label, the case for its rung rests on making the quality difference visible to shoppers.
- Pack and format. A Best in a different size or format is harder to compare like for like with the premium own label. Shoppers can still compare wherever the shelf label shows a price per kilo, so the new format has to offer something shoppers value.
- List price. The manufacturer sets its list price against what shoppers will pay for Best, and may publish a recommended retail price as direction only. Where the shelf price lands is each retailer's decision.
- The rung itself. A Best with no visible step may need to be rebuilt as a stronger premium line, or be withdrawn. Which lines stay and how much space each gets are the retailer's decisions, so the brand can only propose that the space go to Better.
The manufacturer does not agree, set or enforce a price gap with any retailer.
A brand that checks its gaps only at the bottom of the retailer's ladder misses where it is losing, and the answer lies in its own quality, pack, list price and range.
References
- Tesco, interim results 2026/27, 8 October 2026 (26 weeks to 29 August 2026): "Group sales up +1.6% at constant rates including +2.1% in the UK"; "Finest continues to outperform, with sales up 9%."; "Finest once again delivered strong sales growth across all regions, including UK +8.9%; over 350 new and improved products launched"; "Cheapest full-line grocer, with c.700 Aldi Price Match products and more than 10,000 Clubcard Prices". tescoplc.com
- Sainsbury's, 13 February 2026: "Sainsbury's has today announced that its Taste the Difference range has surpassed GBP 2 billion in sales."; "over 60 per cent of our customers shop both Aldi Price Match and Taste the Difference in the same basket". corporate.sainsburys.co.uk
- Worldpanel by Numerator, 6 January 2026 (four weeks to 28 December 2025): "Premium own label continued its upward march, with growth of 9% taking a significant 7.5% of overall sales, up from 7.1% last year." kantar.com
- Grocery Gazette, 21 January 2026: Morrisons' "group like-for-like sales increased by 3.4% in the six weeks to 4 January 2026 and the premium label Best range saw its sales go up by 17.4%." grocerygazette.co.uk
- ITV News, 5 October 2026: Lidl GB "revenues of GBP 13 billion for the year to the end of February, an increase of 10.8%"; "a 12% year-on-year increase in sales of its Deluxe range". itv.com
- Grocery Gazette, 27 March 2026: "Aldi has achieved a milestone of hitting GBP 1.6bn in annual sales for its premium label, Specially Selected, which marks an 11 per cent increase year-on-year."; "the growth was driven by a switch from branded products to the retailer's premium own-label range". grocerygazette.co.uk
- Simon-Kucher, "The rise of private label: why brands must redefine their worth", 15 April 2026: "34% of consumers frequently buy basic private label products."; "30% are now purchasing premium private label offerings." simon-kucher.com
- Worldpanel by Numerator, 15 September 2026 (four weeks to 6 September 2026): "Branded goods outpaced own label this month for only the second time in the past year, with sales up 3.7% compared to 2.9% growth for own label - a reversal of a pattern that has defined much of 2026." worldpanelbynumerator.com
Keep going
Pair this with the playbook and the lessons that teach the methods behind it.
Playbook
Respond to private label growth. Two options, from holding the list price and investing in the brand to a selective price and pack response, and a question on what to do when the retailer closes the quality gap with a premium own-label tier.
More from the blog
Three ways brands are fighting back against private label. Holding the list price and investing in the brand, reworking price and pack, and premiumizing.
The squeezed middle. The compromise effect on a brand's own ladder, and why the middle rung is the one most at risk.
Lessons inside the course
Good-better-best →The gaps between rungs, the compound gap, the private label gap, the compromise effect and portfolio profit, all used in this article.Start the lesson → Price tiers and ladders →The tier gap, the value-to-volume ratio, relative price by tier and share of tier: how to read a brand inside each tier.Start the lesson → WTP and consumer value →How the quality shoppers see sets their willingness to pay (WTP), the basis for a Best rung's premium.Start the lesson →Try it free
Cross-Lever Impact Simulator. This link opens it with the premium mix two points lower, 23 percent instead of 25, on the tool's own biscuit portfolio in dollars: gross profit falls 1.6 percent. This second link raises the premium mix to 35 percent, the trade-up case, and gross profit rises 8.1 percent. Free and without sign-up.