Which RGM Lever to Pull First: The Decision Tree for Pricing, PPA, and TPO
Five questions that tell you whether to move price, pack, or promotion first.
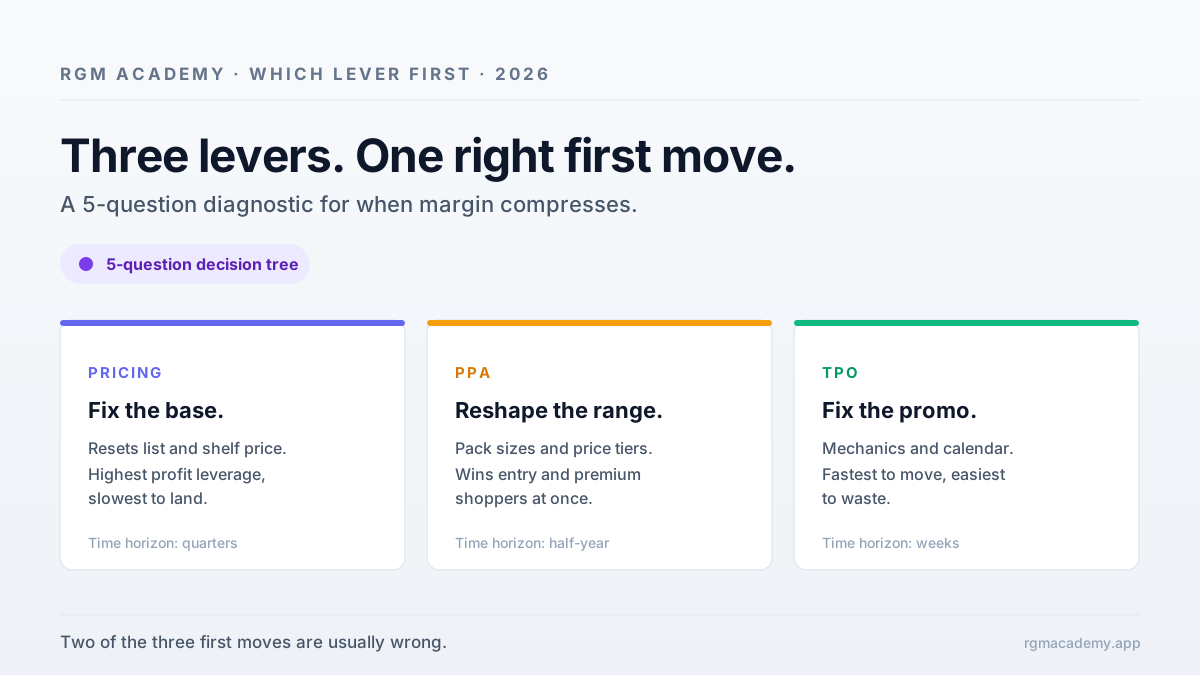
The short version
- Pricing, pack architecture, and promotion are not substitutes. They have different profit shapes, different time to value, and different reversibility, so the right first move depends on the leak in front of you.
- Most teams reach for a list-price rise because it books fastest in next month's report. The volume hit lands at full elasticity in the same window, often in front of two competitors who can follow in five minutes.
- Price is the most leveraged input: a 1 percent gain in realised price lifts operating profit by about 11.1 percent, more than the same gain from cost or volume.1 But that leverage only pays if the volume loss stays under the break-even.
- Five questions decide it: is the leak category-wide or brand-specific, how visible is the move, can you take the volume hit, is the retailer squeezed, and are you sitting on a price threshold.
- The tree mostly tells you when pricing is the wrong first move. Pass all five and pricing leads, with promotion in support. Fail the retailer question and you fix trade terms first; fail the threshold question and a pack move is safer.
- Most of the value is in sequencing, not in pulling every lever every cycle. Run the right one at the right time.
Three commercial leaders walk into the same Monday meeting with the same flat-margin problem and three different first moves. Two of them are wrong. The five questions below tell you which lever to pull first, and why the loudest voice in the room is usually reaching for the wrong one.
The argument every commercial leader knows
Walk into the next quarterly Profit and Loss (P&L) review at most Fast-Moving Consumer Goods (FMCG) companies and you hear the same conversation. Three Stock Keeping Units (SKUs) are bleeding gross margin. The Chief Financial Officer (CFO) wants a 3 percent list-price rise. Marketing wants to fund a deeper promotion. The trade director wants to shrink the entry pack and quietly recover margin per kilo. The Chief Commercial Officer (CCO) has thirty minutes, and the meeting ends with the decision the loudest voice argued for.
What is missing is a way to decide which of the three Revenue Growth Management (RGM) levers fits the leak. Most teams default to the lever that shows up fastest in next month's report. That is rarely the right answer.
Three levers, three shapes
Name them in plain terms first.
Strategic Pricing moves the list price. It is fast to decide and slow to recover from, and it is the favourite first move because the arithmetic is real: a 1 percent gain in realised price lifts operating profit by about 11.1 percent, more than the same gain from cutting variable cost or adding volume.1 The constraint is elasticity. Published meta-analyses put brand-level price elasticity in mainstream FMCG between about negative 1.7 and negative 2.6,23 so the move only pays when the realised volume loss stays under the brand's break-even.
Price-Pack Architecture (PPA) moves the pack, not the price of a fixed pack. It is the structure of pack sizes and the price-per-kilo curve across them. Its profit comes from margin per unit on volume you already sell, not from an elasticity bet, which makes it more durable and less visible to competitors than a price move. The cost is timing: a pack redesign takes about a quarter to specify, source, and slot.
Trade Promotion Optimization (TPO) moves the calendar: which events, which mechanic, what depth, which pack, which week. It is the most tactical of the three and the most error-prone. As NielsenIQ puts it, "over half of all trade promotions result in little to no sales lift, meaning manufacturers are ultimately wasting time and money."4
Why price is the most leveraged input
In a study of 2,463 companies, a 1 percent improvement in realised price lifted operating profit by about 11.1 percent on average. The same 1 percent gain from cutting variable cost was worth 7.8 percent, and from adding volume only 3.3 percent. Price wins because it flows straight to the bottom line with no cost attached, while extra volume drags its own variable cost behind it. That is why price is the tempting first move, and why the discipline is knowing when the elasticity bill cancels the gain.
The five questions
Walk them in order. Each one mostly tests whether a list-price move is the wrong first answer.
One: is the leak category-wide or brand-specific? If margin has compressed across all the major players, the macro is moving against everyone and a price move has cover, because competitors face the same arithmetic and are more likely to follow than to punish. If the compression is yours alone, a mis-built portfolio, a loose promo calendar, a competitor with a sharper pack ladder, there is no cover for the volume you will lose. Pricing is the wrong first move.
Two: how visible is the move to your two largest competitors? A list-price rise on the lead pack of the lead brand is highly visible, and visible moves invite response. A quiet pack change or a promo retune carries lower visibility, which is why a brand under attack often runs those first before going near the list price.
Three: can you take the volume hit for a quarter? A price move at typical FMCG elasticity costs 1.7 to 2.6 percent of volume for every 1 percent of price, before any competitor responds, and it shows up immediately. If the brand cannot absorb that without triggering a listing review, pricing is the wrong first move. A pack move lifts margin per unit on the existing base without the elasticity bet.
How to know if a price move pays
A brand's break-even elasticity is roughly minus one divided by its margin. At a 40 percent margin that is about negative 2.5: if the real elasticity is gentler than that, say negative 2.0, a price rise adds contribution; if it is steeper, say negative 3.0, the volume loss outweighs the margin gain and the move destroys profit. Question three is this formula in plain words. It is also why the same 3 percent rise can be right on one brand and wrong on the brand beside it.
Four: is the retailer's margin stable or under squeeze? Retailers are not passive. A top-five retailer behind on its own margin will read any manufacturer price move as a grab and retaliate through shelf, listing, or next year's calendar. The right sequence then is trade terms first, shifting more of the money from automatic discounts to performance-based ones, before pricing or pack. If retailer margin is stable, both are available.
Five: are you sitting on a price threshold? If the lead pack rests on a round number (£0.99, £2.49, £4.99), a list-price move crosses a cliff. Local elasticity at psychological thresholds is far higher than at mid-band prices, so a routine 4 percent rise can produce a volume drop well beyond what the brand's average elasticity would predict. A pack move is safer because it changes the unit being priced (a 320 gram pack at £2.99 is not on the same threshold as a 350 gram pack at £2.99) without crossing the cliff.
A worked example: a flat-margin biscuit brand
A mid-tier biscuit brand, 14 percent share, has lost 80 basis points of gross margin over four quarters. The CFO wants a 3 percent list-price rise on the premium tier. Marketing wants a deeper promotion in week 22. The trade director wants to shrink the entry pack from 350 grams to 320 grams to recover margin per kilo without touching the shelf price. All three are reasonable. The five questions sort them out.
Cost inflation has plateaued and two larger rivals have absorbed the residual rather than passing it through, so the leak is brand-specific, not category-wide. A 3 percent move on the premium tier of a 14-share brand is highly visible to those rivals, who both watch weekly sales data. At an elasticity near negative 2.0 it implies roughly a 6 percent volume hit, which the brand cannot take on a slow-moving premium line without listing risk. The top retailer's margin is stable, so trade terms are not the first move. And the entry tier sits at £1.49, a threshold price, while the premium tier sits at £2.49, mid-band.
So the answer is not one lever. Architect the entry tier down from 350 to 320 grams to recover about 70 basis points on the largest-volume pack without touching the £1.49 anchor. Take a smaller, less visible list-price move on the premium tier. Retune the calendar from depth to feature-and-display on the routine tier, which preserves the reference price. Pack-led, with a smaller pricing move and a retuned calendar behind it.
Five mistakes this stops you making
Treating the levers as substitutes. They are complements. The biscuit answer used all three in sequence; the teams that beat their categories run a calendar that connects them rather than picking one and neglecting the rest.
Pulling pricing first because it books fast. The list-price move lands in the planning system this cycle, which is exactly why it is over-used. The volume hit lands in the same window.
Pulling promotion first because the retailer asked. Retailers ask for depth because the basket effect benefits them. A yes without a promotion return on investment (ROI) gate is a slow transfer of your margin.
Treating PPA as a one-time reset. The pack ladder is a standing architecture, not a single project. Brands that reset once in 2022 and never revisited have been handing entry-tier space to private label since.
Ignoring the cross-lever interaction. Every price move shifts the pack ladder, every promotion shifts the reference price the next price move is tested against, and every pack redesign changes the basis of the promotion ROI calculation. Treating the three as independent is wrong on the maths and wastes money.
Using the tree
The tree is not a substitute for judgment. It is a way to make sure the five questions get asked before the answer is locked in. If your last margin review ended with "we will take a price rise" before anyone walked question one to five, the next one will repeat it. The framework also tells you when not to move: if the answers are all moderate with no clear signal, wait, get a better dataset, and revisit. RGM is sequenced, not synchronous, and most of the value is in running the right lever at the right time.
References
- Marn, M.V. and Rosiello, R.L. "Managing Price, Gaining Profit." Harvard Business Review, September to October 1992. In their study of 2,463 companies, a 1 percent improvement in price lifted operating profit by about 11.1 percent on average, against 7.8 percent for a 1 percent cut in variable cost, 3.3 percent for a 1 percent volume gain, and 2.3 percent for a 1 percent cut in fixed cost. hbr.org
- Bijmolt, T.H.A., van Heerde, H.J. and Pieters, R.G.M. "New Empirical Generalizations on the Determinants of Price Elasticity." Journal of Marketing Research, 42(2), 2005: mean price elasticity of about negative 2.62 across roughly 1,851 estimates. journals.sagepub.com
- Tellis, G.J. "The Price Elasticity of Selective Demand: A Meta-Analysis of Econometric Models of Sales." Journal of Marketing Research, 25(4), 1988: mean price elasticity of about negative 1.76. journals.sagepub.com
- NielsenIQ. "How to measure trade promotion effectiveness," 2022. "Over half of all trade promotions result in little to no sales lift, meaning manufacturers are ultimately wasting time and money." nielseniq.com
Keep going
Pair this with the lessons that turn each of the five questions into a tool, and with the sister pieces on where the levers are heading.
More from the blog
Why 1 Percent of Price Beats 5 Percent of Volume. The deep dive on the leverage figure behind question three, and why price is the input to defend hardest.
The Great RGM Reset. The macro backdrop: why the balance between these levers is shifting from price-led to volume-led in 2026.
What Is RGM? Where Pricing, PPA, and TPO sit inside the wider six-lever map, for readers who want the territory before the tactic.